Capitalize on today's evolving market dynamics.
With changes to taxes and interest rates, it's a good time to meet with a wealth advisor.

The U.S. national debt totals $39.2 trillion, keeping the topic of debt levels in focus for investors.
Higher interest rates have lifted the cost of financing U.S. national debt and made Treasury demand more important.
Debt risk remains manageable today, but long-term sustainability depends on growth, investor confidence and disciplined portfolio planning.
The U.S. national debt totals $39.2 trillion, and federal debt has roughly doubled over the past decade. 1 Policymakers, investors and business leaders continue to focus on the issue because higher debt can influence interest rates, government spending choices and market confidence. Markets have not treated the current national debt as an immediate crisis, but investors should understand how debt can shape long-term investment conditions.
The national debt grows when federal spending exceeds federal revenue, and the Treasury finances that gap by issuing bills, notes and bonds. That process can continue for long periods when investors view U.S. assets as attractive, liquid and reliable. The bigger question is whether rising debt eventually requires higher interest rates to attract enough buyers.
The national debt has not meaningfully disrupted U.S. economic growth or broad capital market performance so far. Investors have focused more on the pace of growth, inflation trends and Federal Reserve policy than on the debt total itself. Higher interest rates impact the discussion because they make debt more expensive to carry than it was during low-rate years.
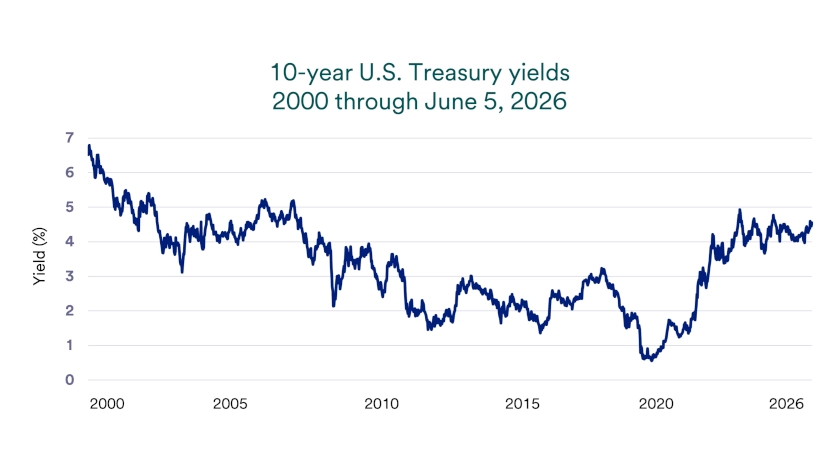
“Markets are aware of the issue, but are not pricing in disruptions,” says Rob Haworth, senior investment strategy director for U.S. Bank Asset Management. “Bond markets are where investor concern over rising debt will be most visible.” The 10-year U.S. Treasury yield has hovered near 4.5%, 2 and Haworth views recent moves as more connected to inflation uncertainty and geopolitical risk than to a market rejection of U.S. debt.
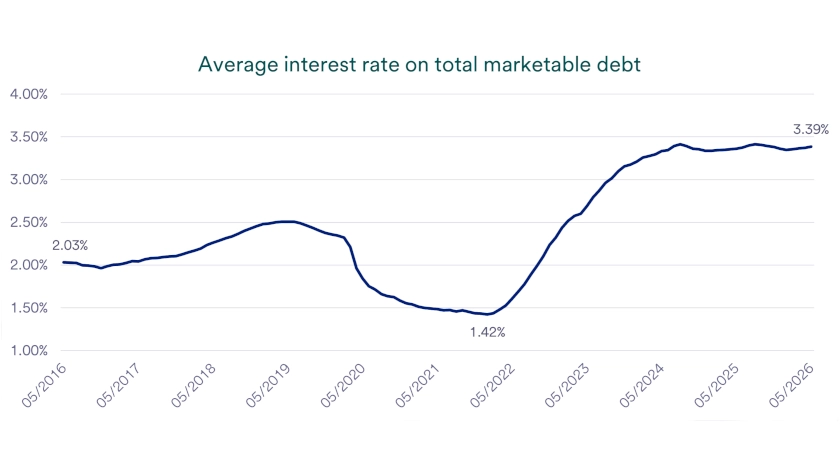
The government’s accumulated debt becomes more important when borrowing costs rise. Interest rates moved sharply higher beginning in 2022, and that shift pushed interest costs into a larger share of federal spending. The average interest rate on marketable U.S. Treasuries reached 3.39% as of June 8, 2026, compared with 1.42% in January 2022. 3
Federal Reserve (Fed) policy can move short-term and long-term interest rates in different directions. At its April 2026 meeting, the Federal Open Market Committee kept the federal funds target range at 3.50% to 3.75%, while acknowledging greater uncertainty around inflation and the economic outlook. Policy uncertainty, growth expectations and inflation risk can create short bursts of bond market volatility.
“Fed rate cuts in 2024 and 2025 pulled short-term bond yields lower,” notes Bill Merz, head of capital markets research for U.S. Bank Asset Management Group. “Meanwhile, the combination of shifting policy forecasts, higher anticipated inflation and stable growth expectations have nudged 10-year Treasury yields close to the high end of their recent range.” Investors can use current policy, growth expectations and inflation expectations to understand why short-term and long-term rates can move differently.
Treasury borrowing remains significant, which keeps the debt conversation in focus. The Treasury continues to issue substantial amounts of debt to fund federal spending needs and refinance maturing obligations, anticipating $574 billion in new issuance in the second quarter followed by $671 billion in the third quarter. 4 Large borrowing totals do not automatically create market stress, but they increase the importance of buyer demand.
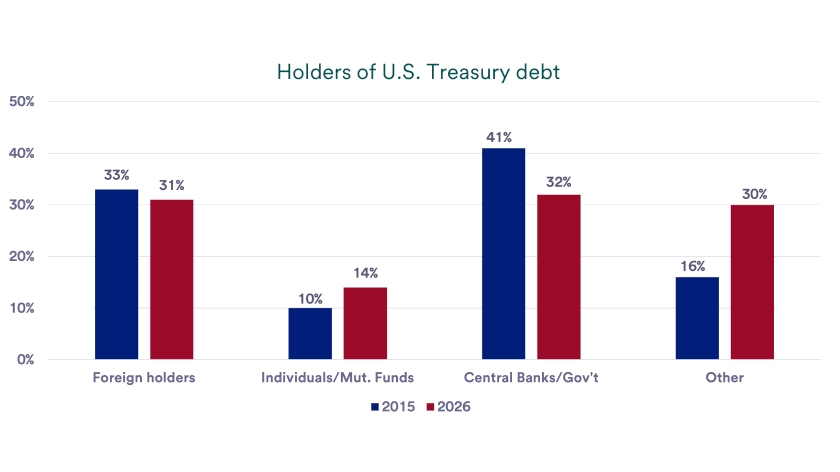
The buyer base has changed over time. Foreign investors remain important, but individual investors and mutual funds have become more significant Treasury buyers. A broader buyer base helps markets absorb heavy issuance, while weaker demand can push interest rates higher because the Treasury may need to offer more attractive yields to bring in additional buyers.
Foreign capital still supports U.S. markets in meaningful ways. Global investors continue to hold large amounts of U.S. Treasury securities and other U.S. financial assets including equities and real estate. That demand reflects the depth, liquidity and perceived reliability of U.S. markets, even as investors continue to monitor the country’s fiscal path.
Investors evaluate debt sustainability by looking beyond the debt total. They also assess what the debt supports, including the size of the economy, the depth of U.S. capital markets, the country’s productive capacity and its ability to attract domestic and foreign capital. The U.S. continues to benefit from large-scale energy production, broad industrial capacity, world-class innovation ecosystems and deep financial markets that give global investors multiple ways to participate in U.S. growth.
The U.S. also retains important advantages in technology development, research, intellectual property creation and business formation. Those strengths support productivity, corporate earnings and long-term economic growth, which can help offset some pressure created by rising debt. They do not eliminate fiscal risk, but they help explain why investors often evaluate U.S. debt alongside the country’s future earning power rather than as a standalone liability.
National security capacity also influences global investor confidence, particularly during periods of geopolitical stress. The U.S. maintains one of the world’s largest and most advanced military forces, supported by public spending, private-sector innovation and deep aerospace and defense supply chains. That strategic position can reinforce demand for U.S. assets, while also reminding investors that fiscal priorities, defense commitments and debt sustainability remain connected.
The U.S. can manage a large debt burden more easily when the economy grows faster than interest costs. A constructive growth outlook rests on resilient consumer spending, steady business investment, capital spending tied to artificial intelligence and infrastructure, and corporate earnings growth. Those forces can support future tax revenue and help investors distinguish between a large debt total and a deteriorating debt outlook.
Growth does not eliminate debt risk, but it can improve the math. Faster productivity, stronger business investment and steady earnings growth can support future tax revenue and help the economy carry a larger debt load. Investors should still separate the growth opportunity from the fiscal challenge, because a stronger economy can slow debt pressure without solving the underlying budget imbalance.
Investors often ask whether heavy Treasury issuance can affect both bond and stock markets. “Higher bond yields, if they occur, could lead investors to put more money into fixed income instruments rather than into stocks,” says Haworth. As a result, higher yields can pressure stock valuations when bonds offer more competitive income, even if the economy continues to expand.
“For now, government debt is not a problem until the bond market deems it a problem,” Haworth concludes. Investors often treat debt as a slow-building force rather than an immediate trigger. Markets can tolerate high debt for long periods, but they can reprice quickly if inflation expectations rise, growth weakens or investors demand more compensation for risk.
Debt also influences the relative appeal of different asset classes. If investors demand higher yields to buy Treasury securities, bond prices can fall and equity valuations can face pressure. If yields stabilize while earnings continue to grow, stocks can still perform well, and bonds can continue to provide income and diversification.
The national debt does not appear to pose an immediate market risk. “The government’s debt is manageable today,” says Bill Merz, head of capital markets research for U.S. Bank Asset Management. “But the ability to sustain rising debt levels over time concerns investors.”
“The government’s debt is manageable today. But the ability to sustain rising debt levels over time concerns investors."
Bill Merz, head of capital markets research for U.S. Bank Asset Management
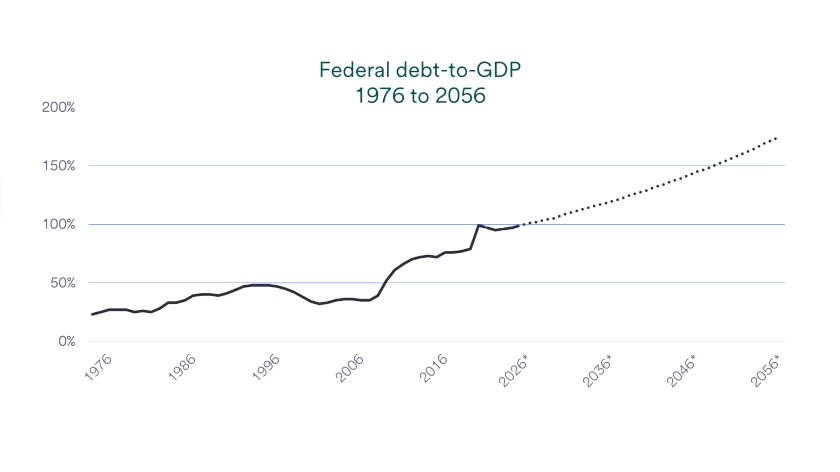
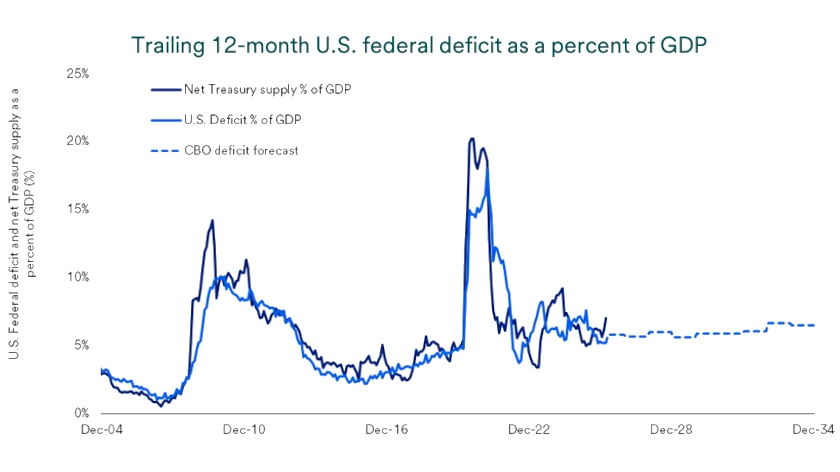
Investors often compare government debt to the size of the economy because that comparison helps frame sustainability. Publicly held debt already stands near the size of the U.S. economy, and the Congressional Budget Office projects debt held by the public to rise from 101% of gross domestic product in 2026 to 120% in 2036. 5 The long-term path matters even without an immediate market shock, because persistent deficits and rising interest costs can gradually limit fiscal flexibility
Reducing the debt would require the government to first reduce or eliminate annual deficits. Haworth notes that paying down debt would also pull money out of the private sector through some combination of higher taxes, lower government spending or both. Those choices can affect household income, business revenue and economic growth, which makes fiscal repair a market issue as well as a policy issue.
Debt headlines can sound alarming, but investors should focus on how debt affects interest rates, market valuations and portfolio income. A larger bond supply and changing demand from major buyers can put upward pressure on rates, although that pressure has not yet become the dominant market force. Interest rates often matter most at the margin, shaping how investors weigh bonds, stocks and cash.
Haworth says interest rates matter for equity investors because higher rates make bonds more competitive with stocks. “Once interest rates stabilized in mid-2023, stock valuations moved higher, reflecting both higher earnings and expectations that rates will trend lower,” says Haworth. That history shows how quickly market leadership can shift when investors believe rates have peaked or stabilized.
Investors can consider equity exposure to capitalize on continued economic growth while still using bonds to provide income, liquidity and diversification. Treasury securities and other bonds still play an important role in a broadly diversified portfolio. U.S. Bank will monitor the government’s increasing debt burden and policies that influence long-run sustainability for signs of change in the broader investment landscape.
Talk with your financial professional to confirm that your plan and investment mix align with your goals and comfort level. Debt discussions can create loud headlines, but long-term results typically come from diversification and disciplined decision-making. A clear plan can help investors stay focused when markets remain calm but uncertainty rises.
The U.S. Treasury pays different interest rates across many types of debt, and those rates change as the government issues new debt and older debt matures. Investors often track the average interest rate across marketable federal debt because it gives a clearer view of the government's overall borrowing cost. That average reached 3.39% as of June 8, 2026, which helps explain why interest costs now consume a larger share of federal spending than they did during the low-rate period earlier in the decade. 2
A wide range of buyers own U.S. Treasury securities, including foreign investors, U.S. households, mutual funds, banks, pension funds and the Federal Reserve. Foreign investors remain major buyers, while domestic investors have taken on a larger role in recent years through direct Treasury purchases and mutual funds. This buyer mix matters because strong demand can help the Treasury absorb heavy borrowing needs, while weaker demand can push yields higher to attract additional capital.
The national debt grows when federal spending exceeds federal revenue, creating annual deficits that the Treasury finances by issuing bills, notes and bonds. Those deficits accumulate over time, so the debt reflects many years of policy decisions, economic cycles, emergency spending and rising interest costs. The debt totaled $39.2 trillion in June 2026, underscoring how quickly the total can rise when deficits persist and borrowing costs move higher.
National debt can affect investors through interest rates, bond yields, stock valuations and future policy choices. If investors demand higher yields to buy Treasury securities, borrowing costs can rise across the economy and bonds can compete more directly with stocks for investor dollars. If growth remains resilient and Treasury demand stays steady, debt can remain a long-term risk rather than an immediate market disruption.
U.S. national debt does not currently represent an immediate market crisis, but the long-term path deserves attention. Publicly held debt already stands near the size of the U.S. economy, and long-term projections point to a higher burden if revenue and spending policies do not change. Investors should monitor whether growth, inflation, interest rates and Treasury demand continue to support orderly markets or begin to show signs of stress.
Investors are increasingly focused on how the administration’s policy changes are impacting markets and the economy.
We can partner with you to design an investment strategy that aligns with your goals and is able to weather all types of market cycles.