Capitalize on today's evolving market dynamics.
With changes to taxes and interest rates, it's a good time to meet with a wealth advisor.
Stocks recovered from spring volatility as earnings growth, consumer spending and AI investment supported market confidence.
Market correction risk depends on inflation, Federal Reserve policy, energy costs and demand for major public offerings.
Broader market participation across sectors, company sizes and global stocks makes the recent rally more durable.
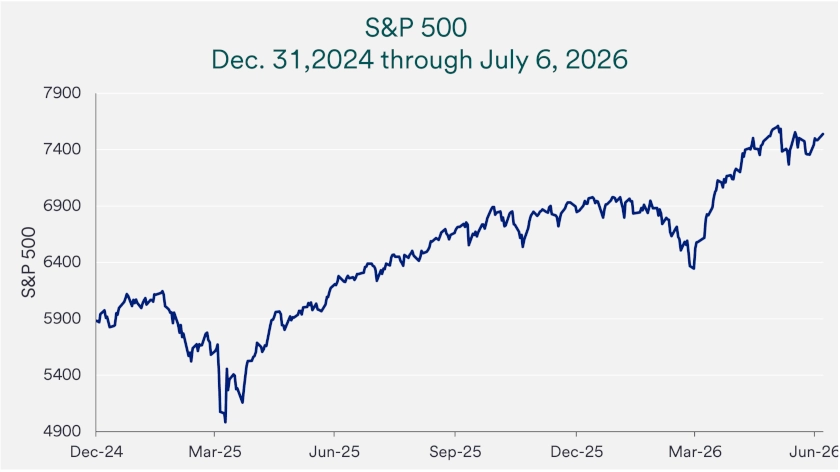
The U.S.-based S&P 500 hit record highs in early June, yet investors continue to ask: Is a market correction coming? Energy prices and geopolitical tensions have eased from the Iran conflict. At the same time, several high-profile initial public offerings (IPOs) could compete for investor dollars if buyers sell other technology or artificial intelligence (AI)-related stocks to participate.
Investors also want to know whether stock market strength can continue as the United States heads toward midterm elections this fall. The answer depends less on any single headline and more on whether earnings growth, inflation, Federal Reserve (Fed) policy and market leadership continue to reinforce confidence. Those indicators can help investors evaluate whether the recent rally looks durable or whether risks could build into a more meaningful market pullback.
Stocks across company sizes and global regions remain near all-time highs. U.S. large-cap, mid-cap and small-cap stocks pulled back in March as energy costs rose after the Iran conflict began. They later recovered as investors refocused on the broader growth outlook.
The S&P 500 Index rose above 7,600 before slipping more than 4%, but still stands nearly 19% above its March low. 1 That pattern suggests investors remain willing to look through short-term volatility when earnings, spending and growth expectations hold up. It also shows why a sharp but limited pullback does not automatically signal a stock market crash or bear market.
Global markets show a similar pattern. Developed international stocks, represented by the MSCI EAFE Index, remain slightly below late-February highs but have recovered their 13% conflict-related decline. 1 Emerging market stocks, represented by the MSCI Emerging Markets Index, have moved even higher, testing new highs and gaining more than 24% year-to-date as semiconductor strength and improving earnings expectations support investor confidence. 1
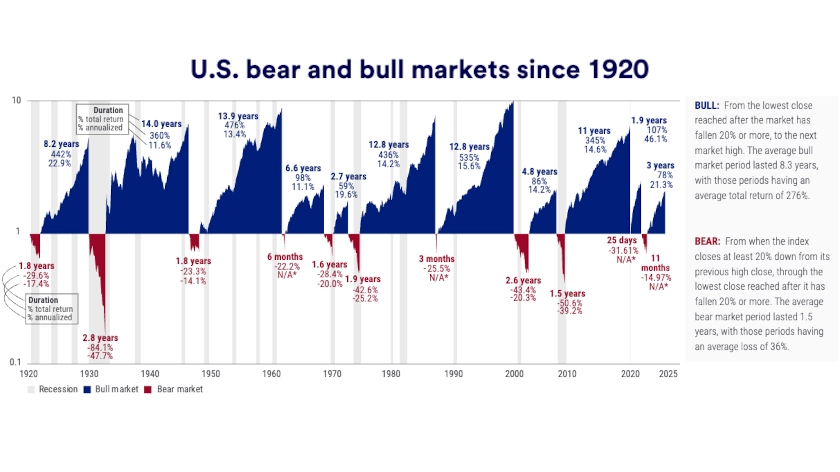
Investors continue to reassess risks, but the market’s recovery points to changing expectations rather than a lasting break in economic fundamentals. Even with recent volatility, stocks have stayed outside traditional correction territory. Many investors define a market correction as a 10% decline from a recent high, while a 20% drop typically signals a bear market, so those reference points help put market moves in context.
Corporate earnings remain one of the strongest foundations for stock prices. In the fourth quarter of 2025, S&P 500 companies reported revenue and profit growth of nearly 13% from a year earlier. First-quarter 2026 earnings grew more than 28%, as business investment and consumer demand continue to lift company revenues. 1
As companies approach the second quarter reporting season, analysts expect 23% earnings growth from a year ago. Strong earnings do not prevent volatility, but they can give investors a fundamental reason to maintain higher stock prices. Investors will watch whether companies can continue turning sales growth, investment spending and consumer demand into rising profits.
Large business investment, including AI-related spending, has become an important earnings driver. Companies building AI systems are buying chips, cloud capacity, networking equipment and other infrastructure from companies that supply those tools. That spending creates a chain effect: one company’s investment becomes another company’s revenue, which can then flow through to broader profit growth.
These investments may also improve productivity across the economy over time. For investors, the key question is whether AI spending continues to generate revenue opportunities for companies that supply the technology, equipment and services behind adoption. If that spending slows or investors question the return on investment, AI-linked market leaders could face more scrutiny.
Resilient consumer spending provides another pillar of earnings growth. Higher-income consumers continue to spend on travel, services and premium goods, helping sustain overall consumption even as lower-income households become more selective. 1 Last year’s “One Big Beautiful Bill Act” also improved cash flow through business tax cuts and household tax relief.
Tax refunds running ahead of last year have helped offset some pressure from higher energy costs and inflation. 2 That extra cash flow can help company revenues because consumer spending remains a major driver of the U.S. economy. Investors will watch whether households continue spending, especially if inflation, interest rates or energy prices rise again.
“Estimated earnings growth for 2026 is 24%, and 17% for 2027, according to Bloomberg, FactSet and S&P Capital IQ,” notes Terry Sandven, chief equity strategist for U.S. Bank Asset Management Group. “Those forecasts point to resilient business and consumer spending expectations.” Those forecasts help explain why investors have continued to show confidence in stocks near record highs, even as market correction concerns remain.
Monetary policy remains a key source of market sensitivity. Interest rates influence borrowing costs, stock valuations and investor willingness to take risk. After multiple interest rate cuts in 2024 and 2025, easier borrowing conditions supported housing activity, business investment and stock prices.
More recently, resilient economic growth and higher energy costs have led investors to consider whether the Fed may need to keep policy tighter for longer or even raise rates by year-end. CME FedWatch data from July 6, 2026 indicates 76% odds of at least one 0.25% interest rate hike by the December 2026 Fed meeting. That reading does not predict the Fed’s final decision, but it shows how quickly markets can adjust expectations when inflation, energy prices and consumer demand change.
If markets begin to expect higher interest rates, stock prices could come under pressure. Higher rates can make bonds and other income-generating investments more competitive with stocks. They can also weigh on stock valuations, which reflect what investors are willing to pay today for future corporate profits.
Major initial public offerings could also influence the near-term path for stocks. SpaceX listed shares on June 12 in the largest public offering in history, while OpenAI and Anthropic are expected to pursue public listings later in 2026. South Korea’s SK Hynix, a memory chip maker, is expected to start trading in the U.S. on July 10, after raising more than $28 billion in an IPO of American depositary receipts, or ADRs, which are certificates issued by U.S. banks that represent foreign company shares.
These offerings could attract strong demand because investors continue to seek exposure to artificial intelligence, space technology and other high-growth innovation themes. That demand may create a short-term funding challenge. Investors and fund managers who want to buy new public companies may need to sell existing holdings to make room.
If many investors make that shift at the same time, strong demand for new listings could temporarily pressure current market leaders, even if the long-term innovation theme remains constructive. Technology, semiconductor, cloud computing and AI-related stocks may be most exposed to that rotation because they have already attracted significant investor interest. Even so, selling tied to IPO funding would not necessarily weaken the long-term innovation theme if earnings and investment trends remain constructive.
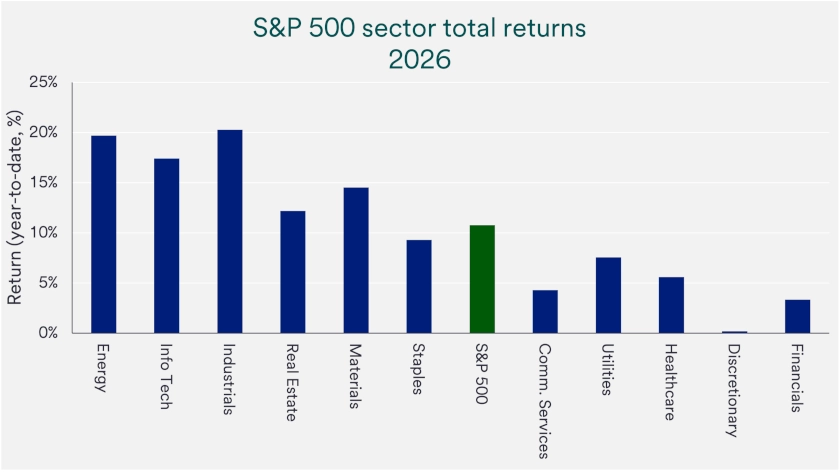
Market leadership has expanded beyond the narrow group of large information technology and communication services stocks that dominated returns in recent years. In 2026, more areas of the market have contributed to performance, including economically sensitive industries, more defensive sectors, midsize and smaller company stocks, and international markets. 1 Broader participation can reduce reliance on one investment theme and make the overall advance more durable.
“Markets tend to be more resilient when leadership broadens, because performance does not depend on one outcome going right,” says Rob Haworth, senior investment strategy director for U.S. Bank Asset Management Group. Haworth notes that wider participation has helped offset volatility tied to geopolitics and sector-specific concerns. A broader rally can also signal that investors are responding to fundamentals like growth, earnings and cash flow, not just a narrow momentum trade.
Market corrections often follow changes in expectations for future economic conditions, not headlines alone. The key risk today is whether the Iran conflict leads to sustained increases in energy and transportation costs that feed into inflation, interest rates and stock pricing. If higher costs last long enough, investors may reprice growth expectations and demand a larger cushion for risk.
“Corrections usually occur when risks move from potential to economic reality. Markets are watching whether today’s uncertainties begin to affect growth, earnings and financial conditions, but corporate earnings strength has dominated other factors so far.”
Bill Merz, head of capital markets research for U.S. Bank Asset Management Group
Other risks remain secondary but worth monitoring. Stress in parts of the private credit market could push borrowing costs higher if refinancing becomes more difficult. Separately, concerns that AI adoption could lead to widespread job losses have not shown up in employment data so far, but investors continue to watch labor trends closely.
“Corrections usually occur when risks move from potential to economic reality,” says Bill Merz, head of capital markets research for U.S. Bank Asset Management Group. “Markets are watching whether today’s uncertainties begin to affect growth, earnings and financial conditions, but corporate earnings strength has dominated other factors so far. Investors will likely keep focusing on whether higher costs start to show up in demand, profits and access to financing.
Periods of volatility often test discipline more than strategy. Investors can start by confirming that portfolios still align with long-term goals and with their comfort level for risk, especially after strong market gains. Market swings do not change time horizons, but they can highlight whether allocations remain appropriate.
For those holding excess cash, a phased approach, gradually putting money to work, can reduce the pressure of trying to pick the perfect day to invest. Reviewing diversification across asset types and regions can also reveal gaps or missed opportunities. These steps emphasize preparation and risk control rather than short-term prediction.
“Volatility creates uncertainty, but it does not eliminate the value of a long-term plan,” says Tom Hainlin, national investment strategist with U.S. Bank Asset Management Group. “Staying invested and diversified and making measured adjustments helps investors remain focused on outcomes that matter over time.” A thoughtful discussion with a wealth planning professional can help separate temporary market noise from developments that may change the long-term outlook and can ensure your investment strategy still aligns with your time horizon, risk appetite and financial goals.
A market correction usually refers to a decline of about 10% to less than 20% from a recent high, while larger declines are often described as bear markets. Corrections can occur even when the economy is growing and often reflect shifting expectations rather than lasting damage. They are a normal part of market cycles.
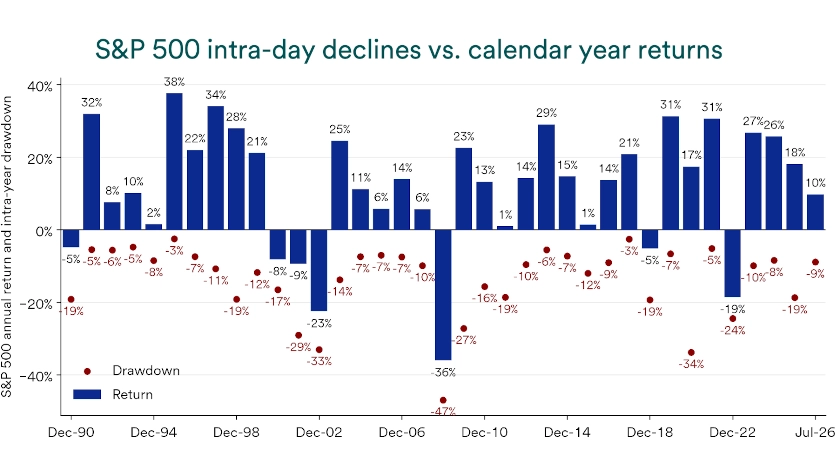
Historically, the S&P 500 has experienced average intra year declines of roughly 14% since 1990, even as long-term returns have remained positive. 1That history shows why pullbacks can occur during otherwise strong years. Understanding this pattern can help investors keep perspective when prices move quickly.
Market corrections can last days, weeks or months, and timelines vary because different catalysts unwind at different speeds. The average correction (10%-20% decline) lasts 17 days, but any single episode can run shorter or longer depending on whether the decline reflects temporary shifts in expectations or deeper economic stress. 1Recoveries also vary because markets often price in new information before it shows up in slower-moving economic data.
Corrections occur often enough that long-term investors generally treat them as part of the market’s regular rhythm rather than as rare events. The S&P 500 has spent 29% of its history since 1927 trading 10% or more below a recent high, which shows that double-digit pullbacks have been common over time. 1That history does not predict the next move, but it helps investors frame volatility as a recurring feature of markets.
Key indicators of a market correction include rising market volatility, sustained increases in energy or interest rates, and growing uncertainty around economic growth or corporate earnings. Corrections become more likely when higher costs or tighter borrowing conditions start to affect consumer spending or business investment. Short-term headlines alone rarely drive sustained declines; lasting changes in economic conditions usually carry more weight.
Many investors start by separating time horizons. Short-term moves can look dramatic, while long-term plans often assume periodic pullbacks along the way. Diversification can help because different investments may respond differently to growth, inflation and interest-rate shifts, which reduces reliance on a single outcome.
Yes, stock market corrections can occur even when the economy is strong. Corrections often follow changes in investor expectations, starting valuations or external shocks such as geopolitical conflict or government policies. Strong economic indicators can support the broader outlook, but they do not prevent periods of market volatility.
Changing interest rates can influence market corrections by changing borrowing costs and how investors value future profits. When interest rates rise, borrowing often becomes more expensive, which can slow economic activity and pressure stock prices as expectations adjust. When interest rates fall, financing typically becomes cheaper, which can support spending and investment and may soften or delay a correction.
Typical warning signs leading to a pullback in the stock market include stretched stock prices, rising interest rates and increasing economic uncertainty. Additional indicators can include weakening corporate earnings, unusually one-sided positioning or heightened geopolitical instability. Investors often watch for when these risks start to show up in real activity, such as slower spending or tighter credit, rather than relying on headlines alone.
The S&P 500 Index consists of 500 widely traded stocks that are considered to represent the performance of the U.S. stock market in general. Equity securities are subject to stock market fluctuations that occur in response to economic and business developments. Diversification and asset allocation do not guarantee returns or protect against losses.

Discover how the stock market is impacted by the policies enacted during President Trump’s second term in the White House.

We can partner with you to design an investment strategy that aligns with your goals and is able to weather all types of market cycles.