Capitalize on today's evolving market dynamics.
With changes to taxes and interest rates, it's a good time to meet with a wealth advisor.
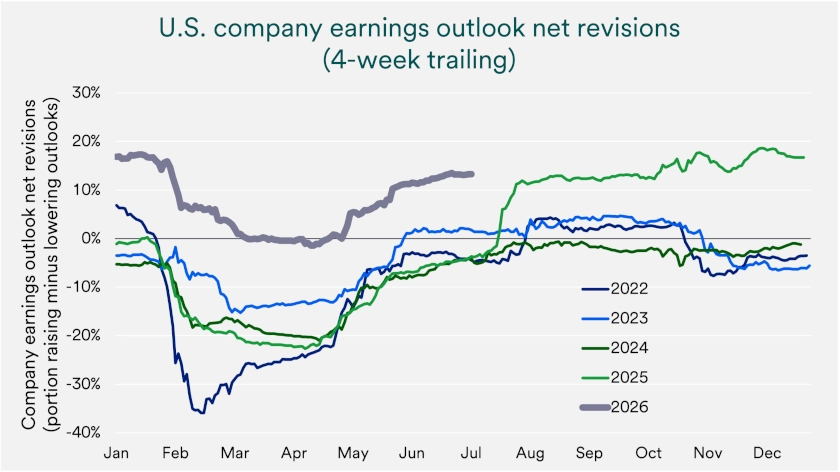
First-quarter corporate earnings topped expectations, with sales up 11.7% and earnings up 28.0% year-over-year.
Quarterly earnings remain a key test as companies increase artificial intelligence and infrastructure spending.
Inflation, interest rates and energy prices could pressure valuations, making diversification and long-term discipline important.
First-quarter earnings results delivered a clear message: many large U.S. companies continue to grow profits faster than analysts expected. Revenues rose 11.7% year-over-year while earnings grew 28.0%, well above initial forecasts of 9.6% and 13.0%. 1 This represents the sixth consecutive quarter of double digit earnings growth for the S&P 500, supporting stock prices even as many investors already viewed valuations as elevated.
“The equity market is still trending higher. That goes back to healthy fundamentals,” says Terry Sandven, chief equity strategist for U.S. Bank Asset Management Group. “Most importantly, consumer and corporate technology spending both remain strong, corporate margins are robust, and inflation doesn’t appear problematic.” Investors will continue to test that view as more companies discuss pricing power, wages, and demand trends in the second half of 2026.
“The equity market is still trending higher. That goes back to healthy fundamentals. Most importantly, consumer and corporate technology spending both remain strong, corporate margins are robust, and inflation doesn’t appear problematic.”
Terry Sandven, chief equity strategist for U.S. Bank Asset Management Group
Earnings season also showed that corporate results can remain strong even when markets react sharply to headlines. During the first six months of this year, volatility rose as investors weighed rapid capital spending, limited visibility into future profits, debate over artificial intelligence’s impact on business models and the recent Middle East conflict. Even with those crosscurrents, the earnings picture improved as the year progressed, and profit growth continued to run above early forecasts. Consensus expectations call for year-over-year sales and earnings growth of 11.9% and 23.1%, respectively, in the second quarter, supported by underlying economic strength.
Consumer spending remains resilient, but the strength varies by income group. High-income consumers continue to prioritize travel, dining, luxury goods and experiences. Rising asset values, lower exposure to unemployment, and accumulated savings have strengthened spending power and supported discretionary purchases.
Middle-income consumers continue to participate in the expansion, but they appear more selective. They are still spending at levels consistent with a stable economy, while making more deliberate choices about where to spend. Management teams often describe this pattern as "choiceful spending," which means consumers are focusing more on value, convenience and purchases they view as priorities.
Lower-income consumers face more pressure. Higher gas prices, persistent food inflation, and reduced Supplemental Nutrition Assistance Program, or SNAP, benefits have strained household budgets. Even so, banks continue to report credit delinquency rates within historical ranges, suggesting broader consumer finances and economic conditions remain stable.
Across income groups, shoppers are paying more attention to value. They increasingly favor affordability, convenience, and product innovation, while putting more emphasis on essential items rather than larger discretionary purchases. As companies report second-quarter results, investors will watch management commentary and financial projections for the back-to-school season to gauge the next phase of consumer demand.
Consumer demand remains an important earnings driver, but corporate reports also show another source of economic support: business investment. Data center infrastructure remains a major growth driver because data centers help power artificial intelligence by processing large amounts of information and supporting digital tools across industries. At the same time, policymakers, local communities, and advocacy groups are paying closer attention to the industry’s power needs, water use, impact on utility costs, proximity to residential areas and reliance on tax incentives.
As AI adoption accelerates and data center construction expands, investors are watching more than the size of the buildout. They also want to know whether policy debates including the upcoming midterm elections could affect sentiment, stock prices or profitability for companies tied to the data center infrastructure buildout. For now, the central earnings question is straightforward: can today’s spending become tomorrow’s profit growth?
Corporate investment has become a major theme of 2026, and technology spending remains robust even as investors demand clearer evidence of future profitability. Several company updates describe faster capital spending, which means money spent on long-term assets such as equipment, facilities and technology infrastructure. Investors have limited visibility into when some of that spending will generate returns, and that uncertainty can create sharp price swings in parts of the market.
That scrutiny is most visible in the spending plans tied to artificial intelligence infrastructure. Large cloud providers are projecting roughly $710 billion of 2026 capital investment compared with about $413 billion in 2025, much of it aimed at computing infrastructure and data centers. 2 Recent market reactions suggest investors want a clearer link between today’s investment and tomorrow’s profits, making “how much are you spending?” and “when does it pay off?” central questions for quarterly earnings.
Investors used first-quarter earnings season to update expectations for the year ahead. Estimates moved higher as the year progressed, with 2026 S&P 500 earnings estimates rising from $310 per share in early January 2026 to $341 as of June 30, 2026. 1 Those rising expectations point to improving confidence in business fundamentals and a policy backdrop that investors viewed as more supportive.
Bill Merz, head of capital markets research for U.S. Bank Asset Management Group, notes, “We remain in an earnings-driven market, but additional supportive catalysts include stimulus from last year’s One Big Beautiful Bill Act and a stable labor market, which supported consumer spending in the first half of the year. Continued consumer and business spending paired with strong corporate margins led to rising expectations for full year 2026 earnings growth across U.S. large-, mid-, and small-cap companies.” Investors will now look to upcoming corporate reports for confirmation that companies can keep turning sales growth into profit growth.
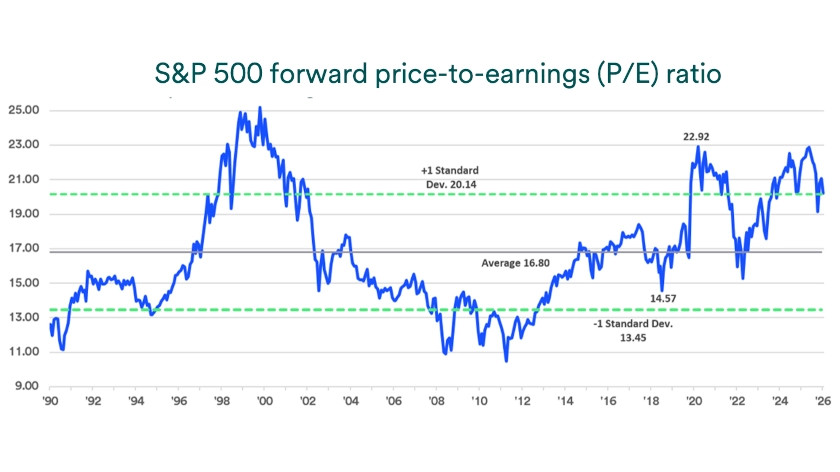
The S&P 500’s projected price-to-earnings, or P/E, ratio, remains above its five-year and ten-year averages. 1 A P/E ratio compares a company’s stock price with its expected earnings, giving investors one way to assess whether stocks look expensive or inexpensive relative to profits. “Sustained earnings growth is crucial for supporting these valuations,” says Rob Haworth, senior investment strategy director with U.S. Bank Asset Management Group. “With valuations elevated by historical measures, companies can’t afford earnings stumbles, and so far, they’ve hit the mark.”
Inflation can weaken valuation support quickly, especially if higher energy costs push prices higher across the economy. “Inflation is kryptonite to stock valuations,” says Sandven. “If energy prices rise and the price of other goods follow, this might force the Federal Reserve to raise interest rates, which could temper corporate earnings.” Investors have watched the U.S.-Israel/Iran conflict closely for that reason, since higher oil prices can lift inflation expectations and change the interest-rate outlook.
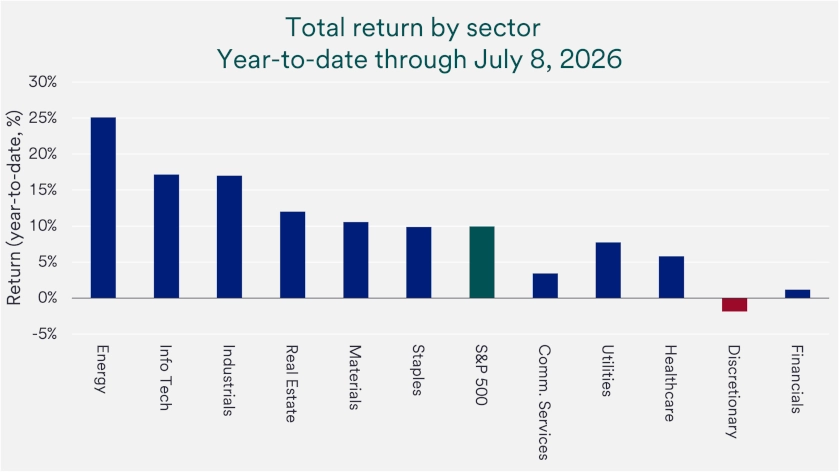
Equity performance in the first half of 2026 was strong and broad-based, consistent with underlying economic strength. Investors balanced strong AI-driven earnings momentum against renewed inflation concerns, rising Treasury yields, and ongoing geopolitical tensions in the Middle East. That mix kept corporate earnings in focus because profits remain the most durable support for stock prices over time.
International emerging markets and small-cap stocks led global equity performance, significantly outperforming international developed markets and large-cap U.S. stocks. Including dividends, the MSCI EM Index gained 24.0% and the Russell 2000 advanced 22.6%, more than doubling the returns of the MSCI EAFE (+9.8%) and S&P 500 (+10.2%). Nine of the eleven S&P 500 sectors posted gains this year, and five sectors advanced more than 10%.
Earnings growth has driven company stock prices higher rather than increases in valuation or investor optimism. The forward 12-month P/E ratio stands at roughly 20.3 times, above the 35-year average of 16.8 times, but still below historical extremes. If inflation does not ramp higher and interest rates do not rise meaningfully, current valuation levels appear supported by the earnings backdrop.
Corporate earnings tend to matter most over longer periods because profits drive long-term stock market returns. In the near term, markets still react quickly to interest rates, inflation and shifting headlines, which can make returns feel unpredictable from month to month. A disciplined approach that matches investments to goals and time horizon can help investors stay focused when the market rotates between optimism and concern.
Many investors can use earnings season as a practical check-in rather than a reason for sudden changes. As you assess your investment options and how to best position your portfolio, consider doing so within a financial plan. Talk with your wealth professional to review whether changes to your investment strategy may be warranted to better reflect your goals, risk appetite and time horizon. A plan can help you stay disciplined when markets swing, while earnings continue to do the steady work of compounding over time.
Companies start with the revenue they generate over a period, usually a quarter, and then subtract the costs required to run the business. Those costs can include what it takes to produce goods or deliver services, day-to-day operating expenses, interest on debt, and taxes. What remains is net income, which investors often call earnings because it shows how efficiently a company turns sales into profit.
In most cases, yes, because “earnings,” “net income,” and “the bottom line” usually describe the same idea. People sometimes discuss other profit measures, such as operating profit or gross profit, which focus on different parts of the income statement. Still, when market commentary discusses corporate earnings, it typically refers to the profit left after a company pays all of its expenses.
Both matter because they answer different questions, and investors often use them together to understand a company’s health. Revenue shows how much a company sells, while earnings show how much of those sales the company keeps after paying its bills. A company can post strong sales growth, but if costs rise faster than sales, earnings may disappoint, and markets often react to that difference.
The S&P 500’s recent rollercoaster performance has investors wondering what lies ahead for the stock market.
We can partner with you to design an investment strategy that aligns with your goals and is able to weather all types of market cycles.