Capitalize on today's evolving market dynamics.
With changes to taxes and interest rates, it's a good time to meet with a wealth advisor.

The U.S. economy continues to grow, reducing near-term recession risk.
Consumer spending, business investment and steady job growth support the expansion.
Inflation, Fed policy and geopolitical risk may keep markets volatile, making diversification and long-term planning important.
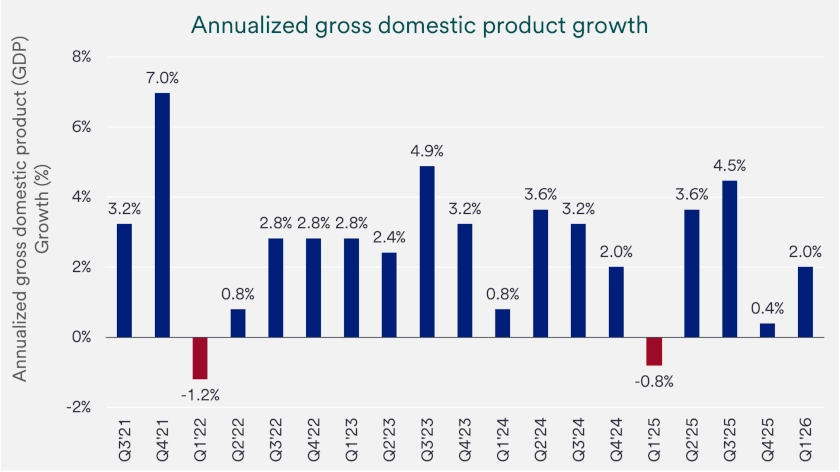
The economy entered mid-2026 with more momentum than headlines may suggest. Real gross domestic product, or GDP, increased at a 2.1% annualized rate in the first quarter, improving from 0.5% growth in the fourth quarter of 2025, according to the Bureau of Economic Analysis (BEA). Business investment, exports, government spending and consumer spending all contributed to growth, while higher imports reduced the headline GDP number because imports subtract from the calculation. Corporate profit growth also improved, and companies continued to invest in equipment, technology and intellectual property, including software. The BEA reported that profits from current production increased by $74.4 billion in the first quarter, a sign that many companies entered the second quarter with support from earnings and ongoing business activity. Consumer spending continued to support the broader economy, even as higher prices, energy costs and interest rates shaped household decisions.
Markets now face a constructive but more selective backdrop. Economic growth, household spending and business investment support long-term opportunities. At the same time, cautious Federal Reserve (Fed) interest rate policy, higher borrowing costs and geopolitical uncertainty can quickly shift investor sentiment.
The U.S. economy continues to expand despite geopolitical tensions, including conflict involving Iran and uncertainty around global energy supply. Recent data point to an economy moving through a slower but still positive phase, not one already in recession. Growth no longer matches the faster pace seen during parts of 2025, but consumers continue to spend, businesses continue to invest, and core economic drivers remain intact.
Inflation complicates the growth story. The BEA reported the personal consumption expenditures, or PCE, price index rose 4.1% from a year earlier in May, while core PCE, which excludes food and energy, rose 3.4%. Those readings remain above the Federal Reserve’s 2% inflation goal and reduce the Fed’s flexibility to cut interest rates quickly.
This mix creates a more selective environment for investors. Corporate earnings and business investment can support longer-term market trends, but companies still need pricing power, durable demand and disciplined cost management. Investors should also expect policy headlines, inflation reports and energy-market developments to influence near-term market moves.
First quarter gross domestic product, or GDP, showed the economy regained traction after a slower finish to 2025. The BEA’s third estimate showed real GDP rose at a 2.1% annualized rate in the first quarter, compared with just 0.5% in the fourth quarter of 2025. The upward revision from the prior estimate mainly reflected a downward revision to imports, partly offset by a downward revision to consumer spending.
Business investment remained an important source of support. The BEA reported that investment contributed to first quarter growth, along with exports, government spending and consumer spending. From an industry perspective, information, federal government, professional, scientific and technical services, and durable goods manufacturing led the increase in real GDP.
The broader private economy remained positive but less forceful than the headline GDP number alone might suggest. Real final sales to private domestic purchasers, which combine consumer spending and gross private fixed investment, increased 1.7% in the first quarter. This measure helps investors look past some trade and inventory swings and focus on domestic household and business demand.
Consumer spending remains a critical driver of U.S. economic growth. BEA data showed personal consumption expenditures increased 0.7% in May, while real PCE, which adjusts spending for inflation, increased 0.3%. Personal income also rose 0.7% in May, and disposable personal income increased 0.7%, giving households additional support even as prices continued to rise. Retail sales also point to ongoing consumer activity. The Census Bureau reported that advance U.S. retail and food services sales rose 0.9% in May from April and 6.9% from May 2025. Retail trade sales increased 1.0% from April and 7.5% from a year earlier, while nonstore retailers, which include many online sellers, rose 12.2% from May 2025.
“Data show that consumer spending remains solid, despite high interest rates and higher costs pressuring lower- and middle-income consumers.”
Bill Merz, head of capital markets research for U.S. Bank Asset Management Group
High-frequency spending data show a similar but more nuanced picture. Fiserv reported that its Small Business Index held steady at 144 in May, with small business sales rising 0.7% from a year earlier. However, average cost per shopping basket rose 3.1% while transaction volume declined 2.4%, which suggests higher prices helped total sales even as customer traffic softened. Weekly retail data also remained firm entering the end of June. Johnson Redbook reported 10.5% year-over-year retail sales growth for the week ending June 27, up from 10.0% the prior week.
These figures reinforce the view that consumers continue to spend, though the mix of spending and the pressure from higher prices vary across income groups and retail categories. Bill Merz, head of capital markets research for U.S. Bank Asset Management Group, notes, “Data show that consumer spending remains solid, despite high interest rates and higher costs pressuring lower- and middle-income consumers.” That pressure does not mean consumers stop spending. It often changes what they buy, when they buy it and which companies benefit, which can separate businesses tied to essential needs from businesses that depend more heavily on discretionary purchases.
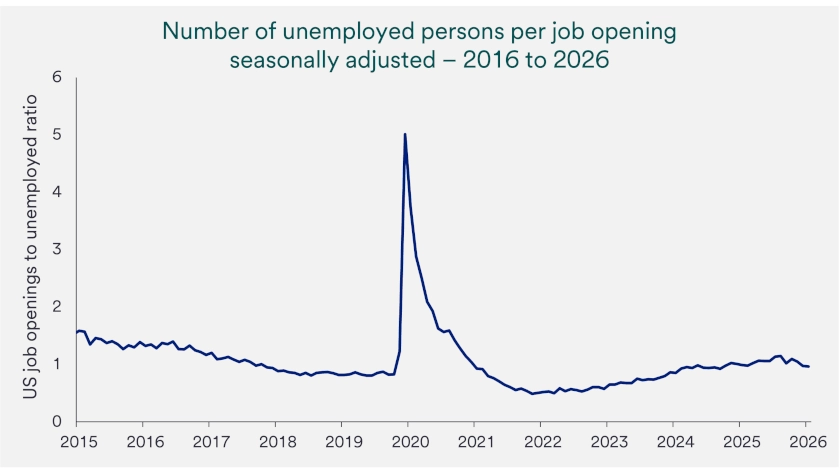
The labor market adds another important layer to the consumer story. The Bureau of Labor Statistics (BLS) reported that total nonfarm payroll employment increased by 57,000 in June, while the unemployment rate edged down to 4.2%. Job gains centered in professional services, social assistance and health care, while employment in leisure and hospitality declined. Steady job growth and wage income help households absorb higher costs, but hiring no longer looks as broad or as fast as it did during earlier phases of the expansion. A stable unemployment rate suggests the labor market remains resilient, but slower hiring in some areas can affect confidence and spending choices over time. Investors should watch whether job gains remain strong enough to support income growth without adding pressure to inflation. Average 2026 job gains so far this year of 92,000 per month compare to 10,000 monthly on average in 2025 and 122,000 monthly in 2024.
Other labor market measures paint a mixed picture. Initial jobless claims remain low, consistent with recent years posting strong labor market growth. 1 Job openings totaled 7.6 million, in May, indicating solid labor market demand with openings above the 7.3 million people counted as unemployed. Those conditions lower near-term recession risk, though they do not eliminate the need to monitor unemployment, job openings, wage growth and household credit stress.
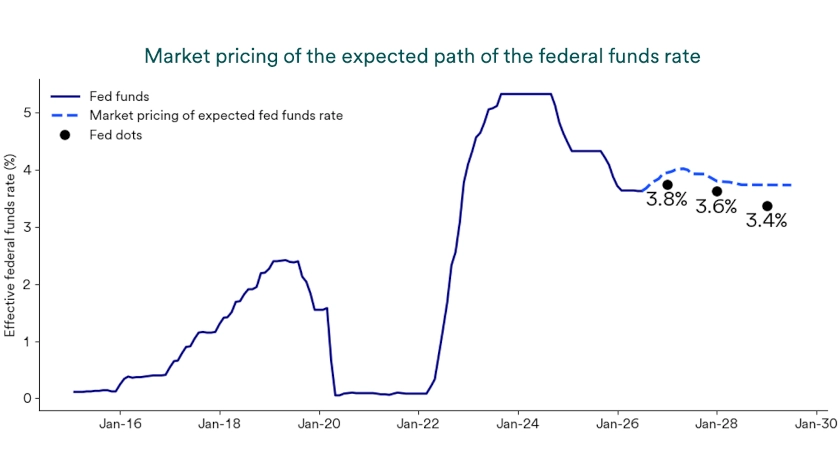
The Federal Reserve kept its target federal funds rate in a 3.50% to 3.75% range at its June 17 meeting. The Fed said economic activity continued to expand at a solid pace, job gains kept pace with the workforce and the unemployment rate changed little. The Fed also emphasized that inflation remained elevated relative to its 2% goal and stated that it “will deliver price stability.”
Investors broadly expected the Fed’s decision to hold rates steady, but markets focused on new Fed Chair Kevin Warsh’s first meeting, the shorter policy statement and reduced forward guidance. Markets moved toward pricing a reasonable chance of a rate hike later in 2026, a shift from earlier expectations for one to two cuts before energy prices rose. This change highlights how quickly inflation and policy expectations can reset the market outlook.
Interest rate policy affects investors because borrowing costs influence mortgages, auto loans, credit cards and corporate financing decisions. Higher-for-longer rates can pressure rate-sensitive areas of the economy, but they can also keep income opportunities attractive in parts of the bond market. Investors should focus less on predicting the exact timing of the next Fed move and more on how different interest-rate outcomes could affect their portfolio, cash flow needs and long-term plan.
The investment backdrop includes both support and friction. Ongoing economic growth, steady consumer demand, and business investment continue supporting corporate earnings. Fiscal policy support in the form of higher tax rebates buy time for a resolution to energy supply constraints. At the same time, uncertain interest rate policy, higher costs, and shifting policy headlines can move investor sentiment quickly.
Artificial intelligence-related investment remains one example of a longer-term business spending theme. In this context, AI investment includes spending on data centers, software, computing systems, energy infrastructure and industrial capacity needed to support greater data use and automation. These investments can support productivity over time, but they also require capital, power and disciplined execution.
Investors should balance the economy’s growth support with the risks that can change market leadership quickly. Inflation remains above the Fed’s target, energy-market developments can affect household budgets and corporate costs, and policy headlines can shift expectations for interest rates. A diversified strategy, aligned with goals and time horizon, can help investors stay focused when recession headlines, inflation reports or Fed policy expectations change.
Investors should consider a number of economic indicators when assessing current economic conditions. These include data on Gross Domestic Product (GDP) growth, inflation, the unemployment rate and other labor market indicators, consumer and business spending, and interest rates. A healthy economic scenario often includes rising GDP, low unemployment, and stable inflation near the 2% level. A recession is typically defined by two consecutive quarters of GDP contraction, often accompanied by a weak labor market, such as rising unemployment.
The economic cycle (or business cycle) tends to move through stages. The expansion phase features rising Gross Domestic Product (GDP), low unemployment, and rising consumer activity. Rising inflation (reflected in increased cost-of-living) may also result. During the economic cycle, activity eventually peaks and a slowdown begins with slower GDP growth. In some cases, that slowdown leads to a recession, where GDP contracts for a period of time. The lowest point of the economic cycle, a trough, is followed by an economic recovery, where GDP again moves into positive territory.
Several factors can influence economic growth through a cycle. These include Federal Reserve monetary policy, particularly the decision to raise or lower interest rates; policies that favor narrow groups of industries rather than the broad economy; and external pressures such as elevated inflation or geopolitical conflicts. These variables can alter the economic environment, often in unpredictable ways.
Investors do not need a perfect forecast to make thoughtful decisions. A clear plan, which spans multiple business cycles, tied to your goals, time horizon, and risk appetite can guide choices when recession headlines, inflation reports or interest rate expectations shift. A conversation with a wealth management professional can help translate economic signals into practical steps that fit your situation.
Note: Diversification and asset allocation do not guarantee returns or protect against losses. The Standard & Poor’s 500 Index (S&P 500) consists of 500 widely traded stocks that are considered to represent the performance of the U.S. stock market in general. The S&P 500 is an unmanaged index of stocks. It is not possible to invest directly in the index. Past performance is no guarantee of future results.
What is a recession? A recession is a broad and sustained decline in economic activity. People sometimes use two straight quarters of falling GDP as a quick rule of thumb, but that shortcut can miss important details. In the U.S., the National Bureau of Economic Research weighs several measures, including jobs, production, income, sales, and GDP, and it often makes its determination after a downturn has already begun.
When was the last recession? The most recent recession began with the COVID-19 shock in early 2020. It lasted only a few months, but it was severe because shutdowns quickly disrupted work and spending. The prior recession was the 2007–2009 period tied to the financial crisis.
No one can predict recessions with certainty, and the economy can change quickly. Today’s data still show growth and ongoing consumer spending, which generally lowers near-term recession risk. The key things to watch include job trends, credit conditions, and whether inflation stays high enough to keep interest rates restrictive for longer.
The S&P 500’s recent rollercoaster performance has investors wondering what lies ahead for the stock market.
We can partner with you to design an investment strategy that aligns with your goals and is able to weather all types of market cycles.