Capitalize on today's evolving market dynamics.
With changes to taxes and interest rates, it's a good time to meet with a wealth advisor.

Consumer spending supports U.S. economic growth, anchored by steady wages, limited layoffs and resilient household finances.
Retail sales and high-frequency indicators show households are still spending, though higher prices and energy costs are shaping choices.
Debt growth remains manageable overall, with income growth and relatively low debt-service burdens offsetting higher borrowing costs.
Consumer spending remains the backbone of the U.S. economy, accounting for approximately two‑thirds of total economic activity. 1 That scale gives household spending a powerful role in shaping U.S. economic growth, corporate earnings and investor confidence. When consumers keep participating in the economy, whether through purchases of everyday necessities like food or shelter or extras like travel and entertainment, they help sustain expansion even as other parts of the economy may cool.
Recent data show robust aggregate consumer spending, partially driven by wealthier households. Households are making more deliberate choices about where dollars flow, but overall demand continues to expand. This spending resilience helps explain why economic growth has stayed constructive despite softer confidence readings, higher borrowing costs and geopolitical uncertainty.
“Consumer spending continues to benefit from steady income growth and a supportive labor market.”
Rob Haworth, senior investment strategy director with U.S. Bank Asset Management Group
“Consumer spending continues to benefit from steady income growth and a supportive labor market,” says Rob Haworth, senior investment strategy director with U.S. Bank Asset Management Group. Paychecks, employment stability and household balance sheet continue to support spending even as consumers become more selective.
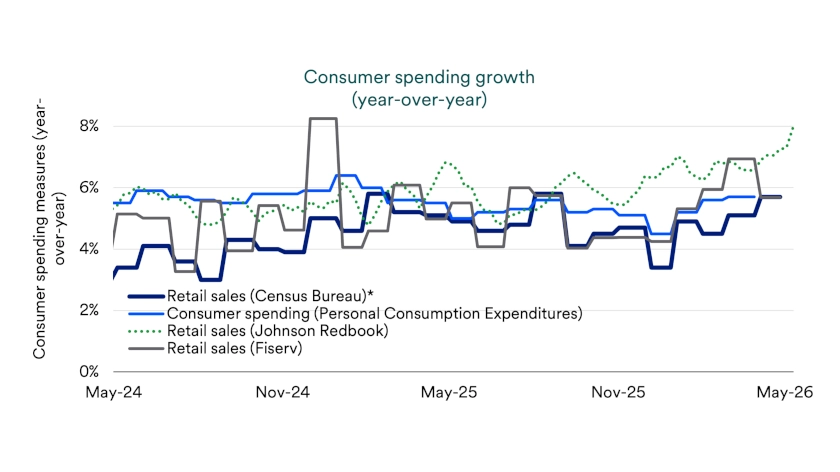
The latest retail sales data reinforce the picture of a consumer that remains engaged. Retail and food services sales rose 0.5% in April 2026 and increased 4.9% from a year earlier, signaling ongoing expansion in household demand. Rising gasoline prices lifted the headline figure, but spending outside automobiles and gasoline increased 4.6% from a year earlier, which suggests consumers are still buying goods and services across a broad range of categories. 2
Several categories continue to lead year‑over‑year growth. Online retailers posted an 11.1% annual increase, while food services and drinking places rose 2.7% over the same period. 2 Those trends point to sustained demand for convenience, services, and experiences, even as higher prices encourage more deliberate purchasing behavior.
Alternative spending indicators tell a similar story. “Consumer spending proxies such as high frequency retail sale data, point-of-sale readings and restaurant bookings suggest aggregate consumer behavior remains solid,” according to Bill Merz, head of capital markets research for U.S. Bank Asset Management Group. Fiserv point-of-sale data show April card-based transactions grew nearly 6% from a year earlier, while Johnson Redbook weekly retail sales data through the week of May 16 show over 8% yearly growth at department stores, warehouse clubs, and supercenters.
The conflict in Iran has pushed national gasoline prices up 50%, according to AAA, since February 27. 3 If those increases persist, higher energy costs could reduce the dollars households have available for other goods and services. Higher fuel prices can also add to broader inflation pressure, which may influence both consumer behavior and Federal Reserve (Fed) policy.
Elevated tax refunds may provide a temporary cushion. Tax cut legislation passed last year has translated to an extra $50 billion in individual tax refunds received so far from 2025 tax returns. 4 At current fuel prices, the extra tax refunds households receive could cover the increase in gasoline spending through early to mid-June, suggesting a narrowing window for Middle East tensions to de-escalate.
An extended closure of the Strait of Hormuz would create a more difficult backdrop. If energy prices stay elevated after tax stimulus offsets have faded, households would likely face more strain. In that scenario, lower- and middle-income consumers could feel the greatest pressure because fuel and everyday necessities typically take up a larger share of their monthly budgets.
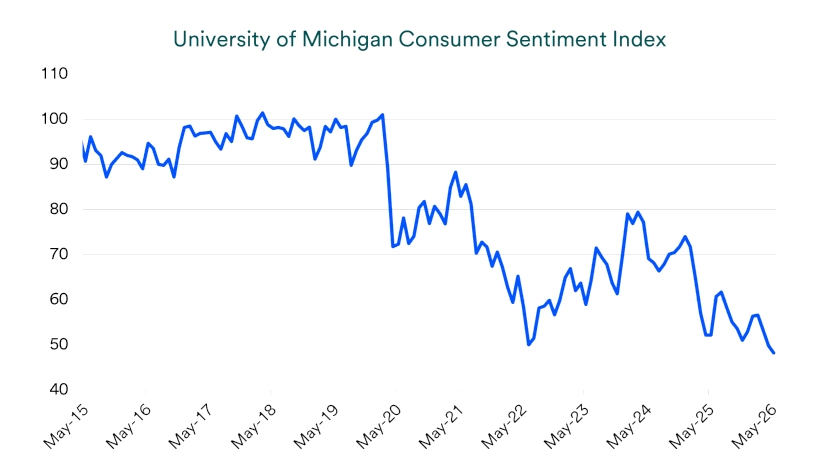
Measures of consumer sentiment continue to lag actual spending behavior. The University of Michigan’s May 2026 survey showed sentiment fell to an all-time low, reflecting persistent concerns around high prices and economic uncertainty. Respondents generally cited elevated prices as a pressure on personal finances. 5
Confidence weakened across a wide range of households. Higher‑income and asset‑owning consumers reported lower sentiment after the Iran conflict and the rise in gasoline prices, while lower‑income and non‑investing households remained cautious. 5 The pattern suggests consumers recognize near-term pressure but may not expect these challenges to persist indefinitely.
The gap between what consumers say and what they do remains important for investors. Confidence surveys can capture anxiety quickly, especially when headlines focus on prices, interest rates, or geopolitical risks. Actual spending data provide a clearer read on whether households are changing behavior in ways that could slow corporate revenue growth or weaken the broader economy.
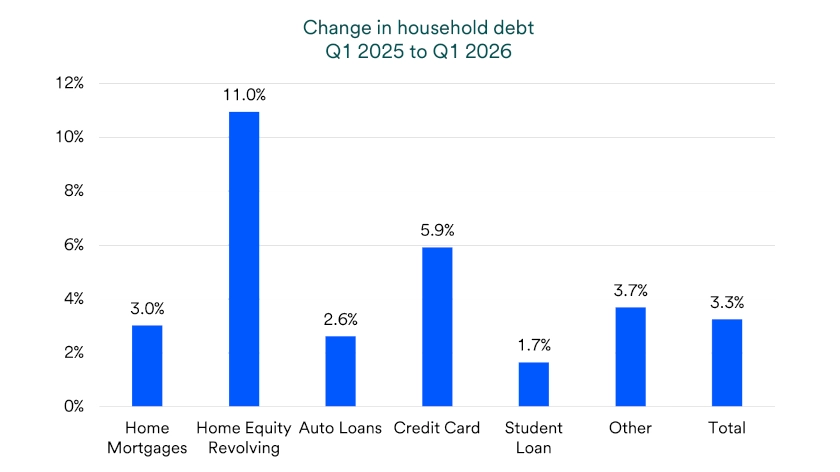
Household debt continues to rise, though the pace remains measured. The New York Federal Reserve reports that total household debt increased 3.3% in the first quarter of 2026 from a year earlier, below the long-term average growth of 4.3%, bringing outstanding balances to $18.8 trillion. 4 For consumer spending, the key question is not the total amount of debt, but whether required payments begin to crowd out other household expenses.
Credit card balances have increased more noticeably. Balances rose in the first quarter and stood 5.9% higher than a year earlier, which can signal pressure for some households as higher interest rates raise borrowing costs. 6 Income growth remains an important offset, especially for households that still have steady employment and manageable monthly payments.
“A key to consumers maintaining healthy balance sheets is that income growth outpaces inflation,” says Tom Hainlin, national investment strategist with U.S. Bank Asset Management Group. Nominal wages continue to exceed the cost of living, even as gains slow for lower‑income households.
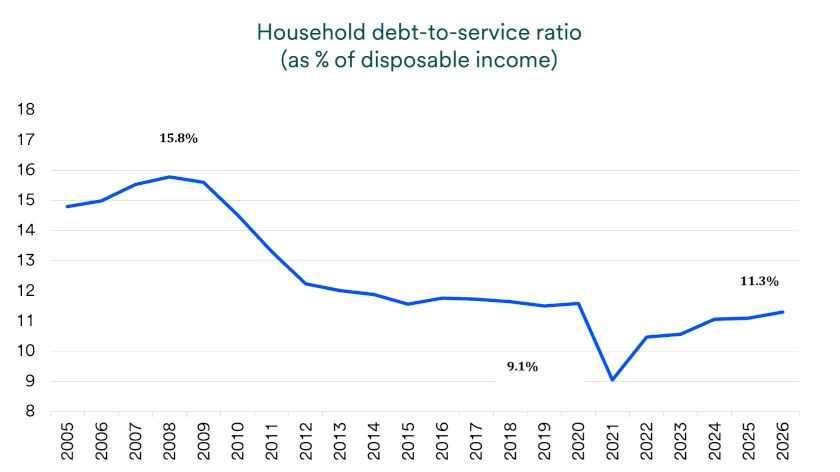
Debt affordability adds helpful context. Household debt payments equal roughly 11.3% of disposable income, well below the 2007 peak of 15.8%. 7 That cushion suggests many households still have financial flexibility, even though higher‑rate borrowing continues to pressure some consumers at the margins.
Labor market conditions remain a critical pillar for consumer spending. Nonfarm payrolls increased by 115,000 in April after March’s 185,000 gain, while the unemployment rate held steady at 4.3%. 1 Job gains in healthcare, construction, and transportation continue to offset declines in federal government employment.
Weekly unemployment insurance data reinforce this picture of stability. Initial claims ticked up modestly to 211,000 in the week ending May 9, but the four‑week moving average stayed near its lowest level since early 2024. 1 Low layoff activity helps preserve income continuity, which gives households more confidence to keep spending rather than pull back sharply.
Wage growth also continues to support consumers. Average hourly earnings rose 3.6% over the past year, helping many households keep pace with higher gasoline prices and sustain purchasing power. 1 “Income growth remains a key stabilizer for consumers as the labor market moves toward better balance,” says Hainlin.
Fed policy will also shape the next phase of the consumer cycle. Interest rates influence borrowing costs for mortgages, auto loans, credit cards and other forms of household credit. Recently, inflation pressures from energy prices prompted investors to anticipate the Fed may hike rates in 2026. Higher borrowing costs could prompt consumers to become more selective, but steady income growth and low layoffs still provide an important foundation.
Market performance has started to reflect these cross‑currents. Equity markets entered 2026 on firmer footing even as consumer‑oriented stocks lagged broader gains. That pattern reflects investor expectations for slower but continued growth, with stable consumer spending still supporting corporate revenue despite tighter financial conditions.
Consumer behavior remains a central variable for investors. Steady spending, low layoffs and ongoing income growth suggest households can continue supporting economic expansion. At the same time, higher energy prices, uneven confidence and pressure on lower-income households argue for a selective view of companies tied to discretionary purchases.
For long-term investors, the consumer outlook supports a constructive but disciplined approach. Spending resilience can help extend the economic cycle, but the benefits may not flow evenly across sectors, income groups or companies. As Terry Sandven, chief equity strategist for U.S. Bank Asset Management Group, observes, “The durability of the consumer remains a key reason the broader economic outlook stays constructive.”
Consumer spending plays a major role in the U.S. economy, accounting for about two-thirds of total economic activity. 1 What households buy each day helps shape the pace of economic growth. When consumers spend, that money supports business sales, helps companies maintain jobs, and encourages investment in inventory, equipment, and services. Those dollars then continue moving through the economy as workers and business owners spend their income. In that way, strong consumer spending can support broader growth, while weaker spending can slow the economy and, in some cases, contribute to a recession.
The job market is one of the most important forces behind consumer spending. When people feel secure in their income and confident about their finances, they are generally more willing to spend. That confidence often shows up most clearly in optional purchases such as dining out, travel, cars, and home appliances. When economic conditions become more challenging, however, households often grow cautious. Concerns about job stability, rising prices, or slower growth can lead people to delay or reduce spending, especially on purchases that are easier to put off.
Consumer spending often shifts as the economy moves through periods of growth and slowdown. During stronger economic periods, people tend to feel better about their financial outlook and more comfortable spending on travel, cars, and other less essential items. They may also feel more willing to borrow when jobs and income appear stable. During downturns, spending usually changes direction. Households often focus more on everyday needs such as food, medicine, and utility bills, while spending on optional items tends to weaken.
Consumer spending remains one of the clearest signals of economic health because it shows how households are responding to changing conditions in real time. Since the U.S. economy depends heavily on consumer demand, household spending makes up the largest share of economic output. When spending remains steady or rises, the economy is more likely to keep expanding. When spending increases too quickly, it can also add to inflation pressure as demand for certain goods outstrips supply. On the other hand, when households pull back, economic growth often slows and the risk of recession can increase.
As always, investors should work with their wealth planning professional to ensure portfolios align with both current economic conditions and long‑term financial goals.
Consumer spending matters because it makes up approximately two‑thirds of U.S. economic activity and often drives short‑term economic growth. 1 It includes everyday purchases of goods and services, and government agencies track it closely as a key part of gross domestic product and as an early gauge of economic strength. When consumer spending holds up, it supports business revenue and hiring, which can help the economy keep expanding.
Retail sales trends suggest consumer demand remains steady overall. The Census Bureau’s retail and food services sales data rose 0.5% month‑to‑month in April while still running higher than a year earlier, which points to continued spending even as momentum cools. 2 Taken together, the data suggests households are shifting where they spend rather than stepping away from spending altogether.
Rising household debt can be a risk to consumer spending, but the impact depends on whether payments strain monthly budgets. Recent Federal Reserve Bank of New York data shows household debt rose modestly in late 2025, with credit card balances increasing alongside other categories. 4 Even so, broader measures that compare debt with income have remained relatively low by historical standards, which suggests many households still have capacity before debt becomes a widespread spending constraint.
Growth slowed late last year as the government shutdown weighed on activity, while consumer spending, hiring and income trends remained broadly supportive.
We can partner with you to design an investment strategy that aligns with your goals and is able to weather all types of market cycles.