
Capitalize on today's evolving market dynamics.
With changes to taxes and interest rates, it's a good time to meet with a wealth advisor.

The stock market under President Trump gained approximately 39% from the 2024 election through October 20, 2026, as corporate earnings and business investment outweighed policy-driven volatility.
Inflation, slower hiring, and selective consumer spending remain important tests for company revenue, profit margins, and Federal Reserve policy.
Tariffs, energy disruptions, and rising Treasury yields could challenge the 2026 stock market outlook, reinforcing the value of diversification and long-term discipline.
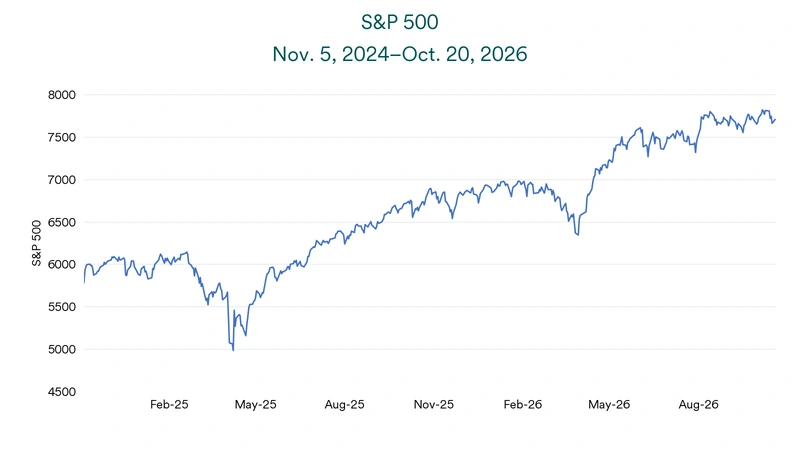
How is the market doing under President Trump? The S&P 500 produced a total return of approximately 39% from the November 5, 2024, election through October 20, 2026, despite a nearly 20% decline in early 2025. Consumer spending, business investment, and corporate earnings helped stocks recover as investors looked beyond recurring policy and geopolitical shocks. The advance shows why earnings and economic conditions usually exert more influence on long-term returns than any single political headline.
“Investors have moved through geopolitical conflict and shifting trade announcements by returning to a durable market driver: corporate earnings growth,” says Bill Merz, head of capital markets research for U.S. Bank Asset Management Group. Market leadership has also widened beyond the largest technology companies, with smaller-company stocks and most S&P 500 sectors participating in the advance. Broader participation points to opportunities across more of the economy, although high valuations leave companies less room to disappoint.1
Corporate profits offer the clearest explanation for stock market performance under President Trump. Revenue growth shows how quickly companies are selling more goods and services, while earnings growth shows what remains after operating costs, interest, and taxes. Healthy results and expectations for another quarter of growth continue to support stock prices, although rising wages, tariffs, and financing costs will test companies’ ability to protect profit margins.1
Record profit margins helped companies convert healthy sales into faster earnings growth and recover from the early-2025 decline. “Sustained earnings growth can support current valuations, but elevated stock prices give companies less room to disappoint,” says Terry Sandven, chief equity strategist for U.S. Bank Asset Management Group. Investors should compare reported results with management guidance because those comments often reveal whether demand, costs, and margins can hold up.
Consumer spending remains a major source of company revenue. Advance Census Bureau estimates show September retail and food services sales rose 6.3% from a year ago. These figures measure dollars spent rather than the quantity purchased, so price increases can lift sales even when households buy fewer items.2
Spending remains uneven across categories and income groups. Higher-income households continue to provide a large share of demand, while many middle- and lower-income consumers compare prices, trade down, and prioritize necessities. Companies that combine useful products with pricing flexibility may navigate this divide more effectively than businesses that depend on broad discretionary spending.
The labor market has softened as September payroll growth slowed and unemployment edged higher. Slower hiring can restrain household income and future spending even before layoffs rise sharply. Investors should track payroll gains, unemployment claims, and wage growth together rather than rely on one monthly report.3
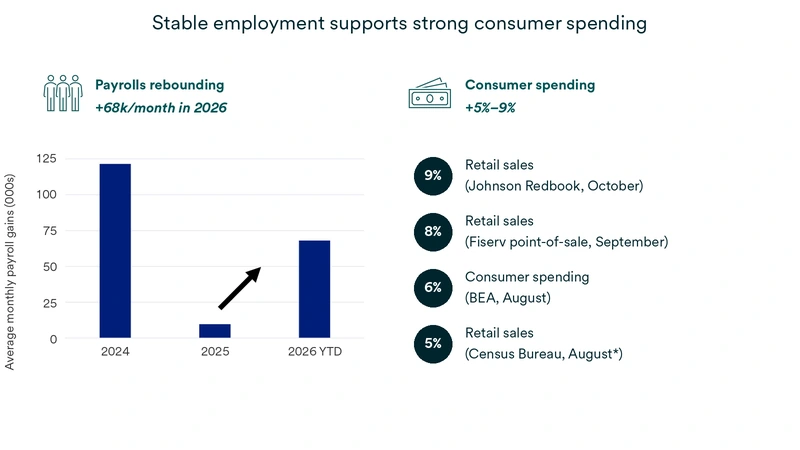
Limited layoffs continue to support household income, but weaker hiring has reduced the economy’s cushion. New unemployment claims help show whether isolated job cuts are spreading across industries. A persistent increase in claims could signal slower consumer spending and company revenue before the unemployment rate moves sharply higher.
Purchases provide a more direct signal than sentiment surveys alone. Households may express concern about inflation while continuing to spend, although the mix increasingly favors necessities and value. A sustained slowdown in job creation would challenge that resilience and weaken the revenue and earnings outlook.
President Trump’s tax policy has supported household cash flow through larger refunds and targeted deductions.1 Refunds can help households absorb higher energy and everyday costs, but they provide a temporary boost rather than lasting income growth. Wage gains and employment therefore remain more durable drivers of consumer spending.
The One Big Beautiful Bill Act, or OBBBA, created longer-lasting changes. Higher deductions for state and local taxes, an expanded child tax credit, and deductions tied to tips, senior income, and certain car loan interest may raise after-tax income for eligible households. The benefit will vary by income, location, and tax situation, so the law will not lift spending evenly across the economy.4
Household provisions may extend support after larger refunds fade, while business provisions can lower the cost of new investment. Neither channel can fully offset a meaningful decline in wage income, employment, or company demand. Tax policy can reinforce growth, but it cannot replace healthy labor demand and sustainable corporate earnings.
Business investment supplies another source of demand and earnings growth. Companies continue to spend on property, equipment, software, and other assets that can expand output or improve efficiency. Artificial intelligence (AI) drives a fast-growing share of investment, but factories, power systems, and supply chain projects also contribute.1
Large cloud computing companies are building data centers and buying advanced chips, but the investment cycle reaches well beyond those firms. Manufacturers are adding factories and equipment, utilities are expanding power generation and the electrical grid, and companies are strengthening domestic supply chains. This broader spending supports technology, industrial, energy, utility, construction, and service businesses.
Capital projects generate current revenue for equipment makers, construction firms, technology providers, and other suppliers. They can also raise future productivity, allowing companies to produce more with the same labor and resources. Faster productivity growth can support profit margins and earnings if demand remains healthy and companies execute projects efficiently.
OBBBA also increases the fiscal trade-off. Household and business tax benefits can support near-term growth, while the Congressional Budget Office estimates that the law will add $3.4 trillion to federal debt over a decade. Larger deficits require the Treasury to issue more bills, notes, and bonds, increasing the amount investors must absorb.4
The Treasury finances deficits by selling short-term bills and longer-term notes and bonds. The average rate on marketable Treasury debt reached 3.52% in September 2026, and the 10-year Treasury yield stood near 5.12% on October 20. Higher yields raise federal interest costs as older debt matures and gets refinanced. They can also increase borrowing costs for households and businesses, slowing spending and investment.
The United States retains substantial borrowing capacity because it has a large economy, deep capital markets, and a globally important currency. Those strengths reduce the risk of an immediate financing crisis, but they do not remove the cost of persistent deficits. A sustained rise in long-term Treasury yields can pressure bond prices, borrowing activity, and the value investors assign to future corporate earnings.
Geopolitical conflict poses the greatest market risk when it disrupts essential supplies or transportation. The Strait of Hormuz carries about one-fifth of global petroleum liquids consumption and a similar share of liquefied natural gas trade. Europe and Asia rely more heavily on imported energy than the United States, but higher global prices still reach U.S. households and businesses through fuel, transportation, and production costs.5
“Investors should ask whether supply restrictions last long enough and market adjustments weaken enough to slow growth, raise inflation, and change the path of interest rates.”
Tom Hainlin, national investment strategist for U.S. Bank Asset Management Group
Energy markets can adapt to shipping restrictions through commercial inventories, strategic reserve releases, additional production, alternate suppliers, and lower demand. These offsets can limit price increases when disruptions remain brief or affect only part of the market. The risk grows when lost supply persists long enough to exhaust inventories and force businesses or consumers to reduce activity.
“Investors should ask whether supply restrictions last long enough and market adjustments weaken enough to slow growth, raise inflation, and change the path of interest rates,” says Tom Hainlin, national investment strategist for U.S. Bank Asset Management Group. The framework connects geopolitical events to consumer spending, business costs, profit margins, and Federal Reserve policy. It also helps investors distinguish a temporary price spike from a lasting change in the economic outlook.
Tariffs are taxes on imported goods, and they remain one of the most changeable policy variables for the stock market under President Trump. They can raise the cost of materials and finished goods, redirect supply chains, and add pressure to consumer prices. The impact depends on the tariff rate, the products covered, available substitutes, and how much of the cost businesses absorb rather than pass to customers.
The Supreme Court ruled in February 2026 that emergency-powers law did not authorize the broad tariffs imposed in 2025, prompting refunds and a shift to other trade statutes. The Trump administration later used Section 338 of the Tariff Act of 1930 to impose additional 50% duties on a range of Canadian goods beginning in August. Canada announced retaliatory measures, and new litigation filed in October shows that legal and policy uncertainty remains high.
Tariffs create different outcomes across industries and companies. Businesses with flexible suppliers, domestic production, or strong pricing power may manage higher costs more easily, while import-dependent companies may face tighter margins. Investors should watch whether tariffs remain a manageable expense or grow large enough to weaken demand, investment, and earnings.
Energy disruptions and tariffs pose a greater threat when they create persistent inflation instead of a brief price increase. Higher inflation can keep interest rates elevated, raise borrowing costs, and reduce the present value of future corporate earnings. Slower job growth complicates the picture by giving the Federal Reserve less flexibility to support the economy while inflation remains above its 2% goal.
The stock market under President Trump has advanced because continued economic growth and corporate earnings have outweighed policy and geopolitical volatility. Consumer spending and business investment continue to support revenue, while healthy margins help turn sales into earnings. Growth has slowed, but positive household demand and capital spending still reduce the near-term risk of recession.
The outlook would weaken if the forces supporting the advance reverse. Rising layoffs could reduce household spending, slower capital investment could limit business demand, and falling margins could prevent revenue growth from reaching the bottom line. A prolonged energy disruption, renewed tariff-driven inflation, or materially higher Treasury yields could pressure several parts of the economy at once and leave the Federal Reserve less room to respond.
A disciplined plan gives investors a more reliable response than short-term forecasts. Review whether your portfolio still aligns with long-term goals, time horizon, and tolerance for market fluctuations. Consider rebalancing when market moves shift allocations away from targets and invest extra cash gradually instead of waiting for a perfect entry point.
Presidential policies can shape taxes, trade, regulation, and the economic backdrop, but they do not determine market returns on their own. Earnings, interest rates, inflation, and investor expectations exert broader influence over time. A thoughtful review with a U.S. Bank Wealth Management professional can help investors separate temporary market noise from developments that change the long-term outlook.
Investors often look at the stock market as a report card on a president, but that view is too narrow. Presidential policy can influence returns through taxes, trade, regulation, and public messaging. Over time, economic growth, inflation, interest rates, corporate profits, and the stage of the business cycle usually matter more than politics alone.
The White House can shape the backdrop, but it does not control stock prices. Investors value stocks based on what they expect companies to earn over time, and those expectations depend much more on profits, growth, and competition than on a single policy headline. Presidents appoint the Fed chair but do not have the power to fire Fed officials over policy disagreements. The Fed also sets monetary policy independently, and Congress still must turn many proposals into law.
Markets usually follow a core group of long-term drivers. Interest rate trends affect borrowing costs and stock prices, inflation affects household buying power and rate expectations, and corporate earnings help determine how much investors are willing to pay for shares. Productivity growth and demographic trends also matter because they shape long-term economic output.
The S&P 500 generated a total return of 81.3% during President Trump’s first term from 2017 to 2021. That ranked fourth for investor returns over a four-year presidential term since 1980.1 The number is strong, but it still reflects the full economic environment of that period, not White House policy alone.
Corporate earnings growth has been the predominant factor driving stock markets to new all-time highs, although market performance during Trump’s presidency also reflects policy choices. In early 2025, proposed tariffs helped trigger a sharp selloff, with the S&P 500 falling nearly 20% by early April 2025, while investors later responded more positively to tax relief and Federal Reserve rate cuts.1 Together, tariffs, tax policy, and interest rates shaped the market more than any single headline.
Politics often drives headlines, but broader economic forces usually do more to shape market outcomes. Investors continue to watch economic growth, inflation, and Fed policy because those forces influence company profits, borrowing costs, and stock prices across the market. Investors are also weighing whether advances in artificial intelligence can support stronger long-term productivity and growth.
Markets rarely move for just one reason. A policy shift, a war headline, or a major economic report can move prices in the short run, but longer periods reflect the combined effect of growth, inflation, earnings, interest rates, and investor expectations. That is why investors usually make better decisions when they focus on the broader economic picture instead of linking every market move to one event.
The stock market under President Trump has produced gains despite sharp swings. Since the November 5, 2024, election, the S&P 500’s total return climbed more than 39% as of October 20, 2026.1
The stock market under President Trump has stayed resilient because profits and consumer demand have held up. Consumer spending is still growing, earnings expectations remain strong, and tax relief and lower interest rates continue to support the economy. Those supports have helped offset pressure from tariffs, oil price spikes, and geopolitical conflict.
Shifting trade policies and fluctuating tariffs triggered volatility in the early months of President Trump’s second term, though markets have since recovered. In 2025, the S&P 500 generated a total return of 17.9%. Year-to-date through October 20, 2026, the S&P 500 is up 13.7%. During the primary years of former President Biden’s four-year term (2021–2024), the S&P 500 generated a 66.3% total return. Trump’s first term (2017–2020) saw an 81.3% total return. Since 1980, Trump’s first term ranks fourth for investor returns over a four-year presidential term. The top three terms were Ronald Reagan (1985–1988, +91.8%), Bill Clinton (1993–1996, +88.6%), and Clinton again (1997–2000, +88.6%).1
Investors should focus on discipline, not fast reactions. Review risk tolerance, rebalance if allocations have drifted, address diversification gaps, and consider phased investing if you are holding excess cash. That approach helps keep portfolios aligned with long-term goals even if volatility continues.

A look at historical equity market performance around midterm elections.

We can partner with you to design an investment strategy that aligns with your goals and is able to weather all types of market cycles.
 Equal Housing Lender. Deposit products are offered by U.S. Bank National Association. Member FDIC. Mortgage, Home Equity and Credit products are offered by U.S. Bank National Association. Loan approval is subject to credit approval and program guidelines. Not all loan programs are available in all states for all loan amounts. Interest rates and program terms are subject to change without notice.