Weekly Economic Outlook
Data-driven insights from the week’s economic reports
Business-focused analysis from the U.S. Bank Economics Research Group
July 10, 2026

The week’s economy at a glance
The Fed’s summer balancing act
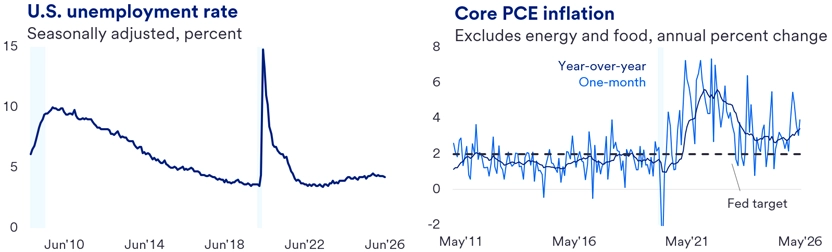
The June Federal Open Market Committee (FOMC) minutes took center stage this week, offering a clearer look at a Federal Reserve that remains on hold but is becoming increasingly concerned about persistent inflation pressures. Policymakers expressed greater confidence in the labor market outlook while continuing to debate whether current interest rates are sufficiently restrictive to return inflation to target. The week’s economic data reinforced our soft-landing narrative. The services sector remained in expansion territory, hiring improved, and the moderate weekly jobless claims reading continued to signal a stable labor market. Meanwhile, the trade deficit widened sharply as imports rebounded, reflecting resilient domestic demand and ongoing investment activity, while existing home sales remained subdued amid elevated mortgage rates and affordability challenges. Taken together, the week's releases suggest an economy that continues to expand at a moderate pace, but one where inflation concerns remain far more prominent than worries about labor market weakness.
What this means for business: For businesses, demand conditions remain generally supportive, particularly across the service sector, while layoffs continue to show little sign of broad-based labor market stress. However, the June FOMC minutes suggest policymakers remain focused on inflation risks, reducing the likelihood of near-term rate cuts and reinforcing the prospect of a higher-for-longer interest rate environment.
ECONOMIC DATA OF THE WEEK
215,000
Initial jobless claims fell by 2,000 to 215,000 in the week ending July 4, matching U.S. Bank Economics Group’s forecast and coming in slightly below consensus expectations. Continuing claims rose modestly, increasing by 8,000 to 1.814 million in the week ending June 27. Despite the uptick, both initial and continuing claims remain below the levels recorded during comparable weeks last year.
Taken together, the data suggest little change in underlying labor market conditions. Layoffs remain limited, and the claims figures continue to point to a “low-fire” environment that should support a stable unemployment rate in the near term. Moreover, the absence of any sustained increase in claims provides little evidence of broad-based workforce reductions across the economy. Despite ongoing discussion of AI and automation, labor market data have yet to show any measurable rise in layoffs that could be attributed to AI adoption.
ECONOMIC REPORT OF THE WEEK
Trade deficit
The U.S. trade deficit widened in May, with the combined goods and services deficit increasing to $77.6 billion from $54.6 billion in April. The increase reflected both weaker exports and stronger imports. Exports fell 3.2% to $317.7 billion, while imports rose 3.3% to $395.3 billion, their highest level since March 2025. The widening deficit was driven almost entirely by a larger goods deficit, partially offset by a modest increase in the services surplus.
Beneath the headline, the import data suggest domestic demand remains resilient. Goods imports increased broadly across categories, with particularly strong gains in capital goods. Imports of computers, semiconductors and related equipment continued to rise, pushing the capital goods category to a new record high. The data are consistent with ongoing investment tied to AI-related infrastructure and technology deployment across the U.S. economy. Some of the increase in imports may also reflect businesses moving purchases forward ahead of potential price increases associated with the conflict in the Middle East. On the export side, much of the decline was attributable to a drop in nonmonetary gold exports, a historically volatile category that can generate sizeable month-to-month swings.
The report also contained some encouraging signs for services exports. Spending by foreign visitors in the United States increased in May, likely reflecting stronger international travel associated with FIFA World Cup events. Nevertheless, the overall rise in the trade deficit will place some downward pressure on Q2 GDP growth. More broadly, however, the details of the report suggest the widening deficit reflects stronger domestic demand and elevated business investment more than any deterioration in underlying economic fundamentals.
CHIEF ECONOMIST QUOTE OF THE WEEK
“The economy is still moving forward, but it’s relying on a couple of pretty strong engines: household wealth and AI investment. When growth depends on only a few cylinders, it pays to keep both hands on the wheel.”
― Beth Ann Bovino, Chief Economist, U.S. Bank
Economic trends: Business cycle indicators
Recession risk: What we are watching
In June, we lowered recession probability to an out-of-consensus 25%, reflecting cooling policy risk (including lower oil prices), an improving labor market, and still-resilient economic activity.
With recession risk still elevated at 25% – well above the 15% long-term average – the key question is: what signals matter in this cycle? In this cycle, the old recession playbook has been humbled. In 2022, every warning light flashed – aggressive tightening, an equity bear market, yield-curve inversion, and recession-level leading indicators. All the signals aligned – yet no recession followed. Why? Consumers had shock absorbers: Low fixed mortgage rates, fiscal support, excess savings, and strong wage growth. The Fed hit the brakes, but households were driving a car with unusually good suspension.
We are now focused on a more real-time stress test: household balance sheets, real income, debt burdens, and the labor market. Old indicators still matter – but they are no longer sufficient. The labor market has shifted from “job hoppers” to “job huggers,” signaling rising caution. At the same time, low-to-middle income households are drawing down savings to offset lost purchasing power from inflation. The key question: how long can that buffer last? Growth is increasingly reliant on a narrow set of supports – household wealth and AI-driven investment – rather than broad-based demand. That concentration keeps recession risk elevated.
Bottom line: a soft landing remains possible – but the margin for error has narrowed, keeping recession risk elevated.
For more commentary, see the Desk of Beth Ann Bovino
Economic trends: Monetary policy
FOMC minutes: Fed on hold, but not at ease
The June 16-17 FOMC meeting minutes reinforce a Federal Reserve that remains on hold but is becoming increasingly focused on persistent inflation risks. Policymakers unanimously left the federal funds rate unchanged at 3.50% to 3.75%, citing continued economic expansion, a stable labor market, and inflation that remains well above the Committee's 2% objective. While the Fed stopped short of signaling an imminent rate hike, the discussion suggests concerns about inflation persistence have intensified and that policymakers are increasingly questioning whether current policy is restrictive enough.
The minutes reveal a Committee that is growing more confident in the labor market outlook while becoming less comfortable with the inflation trajectory. Participants noted that both headline and core inflation had moved higher, attributing the increase to lingering tariff effects, supply chain disruptions associated with the Strait of Hormuz closure, and continued strength in AI-related investment demand. Several participants also observed that inflation pressures have become more broad-based across the economy, while highlighting risks that inflation expectations could become less anchored if inflation remains elevated.
Against that backdrop, the balance of risks continues to tilt toward inflation. Most participants preferred to wait for additional data before adjusting policy, but the minutes show growing support for renewed tightening should inflation fail to improve. A few participants argued there was already a case for raising rates at the June meeting, while others questioned whether current policy is providing meaningful restraint.
Bottom line: The June minutes portray a Federal Reserve that remains on hold but is increasingly concerned that inflation may prove more persistent than expected. While rate cuts remain a distant prospect, the discussion has shifted toward whether current policy is sufficiently restrictive and whether additional tightening could ultimately be required if inflation fails to moderate.
Economic trends: Business activity
Business activity: Services growth moderates, hiring improves
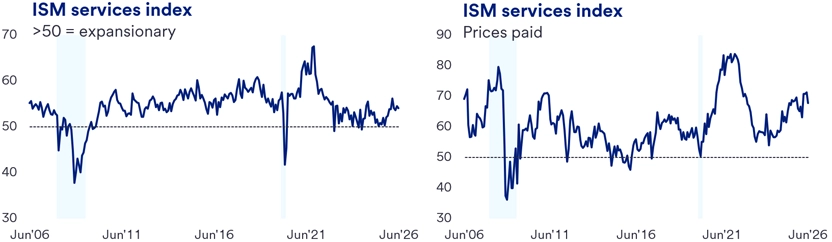
The June Institute for Supply Management (ISM) Services PMI, or purchasing managers’ index, continued to signal expansion in the U.S. service sector, though growth moderated slightly from the prior month. The headline index edged down to 54.0 in June from 54.5 in May, remaining comfortably above the 50 threshold that separates expansion from contraction. While activity slowed modestly, the report suggests the services sector remains on solid footing.
Beneath the surface, the most encouraging development was an improvement in hiring. The services employment index jumped to 51.2, returning to expansion territory for the first time since February and substantially outperforming expectations. The gain is notable because ISM surveys had pointed to persistent hiring weakness in recent months despite continued payroll growth in the official employment data. June's report brings the two measures more closely into alignment, suggesting service-sector businesses may be becoming more comfortable adding workers as demand remains resilient.
The modest decline in the headline PMI was driven primarily by softer new orders, indicating some cooling in demand after several months of strong activity. However, both business activity and new orders remained consistent with continued expansion, suggesting a moderation in growth rather than a meaningful slowdown.
Inflation signals were somewhat more encouraging. The prices-paid index declined to 67.5, its lowest reading since February, suggesting some easing in cost pressures. While the improvement may offer a tentative sign of disinflation in the months ahead, the index remains elevated and consistent with inflation running above the Federal Reserve's 2% target.
Bottom line: The services sector continues to expand at a healthy pace while showing early signs of labor market stabilization. Stronger employment readings and easing price pressures are encouraging, but elevated input costs suggest inflation remains a challenge. Overall, the June ISM Services report remains consistent with an economy growing at a solid pace, supported by resilient service-sector demand and improving hiring conditions.
Economic trends: Housing sector
Existing home sales: Inventory returns, buyers don’t
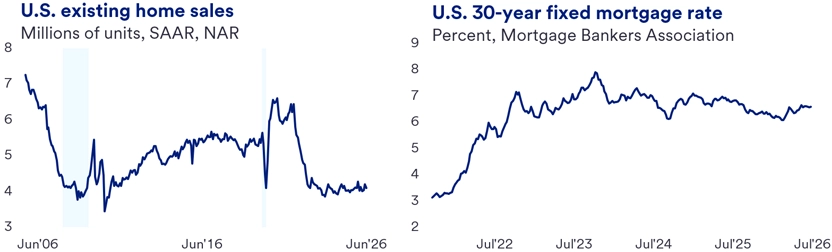
The National Association of Realtors' June existing home sales report disappointed, with sales declining 2.4% month-over-month (MoM) to a seasonally adjusted annualized rate of 4.09 million units, contrary to expectations for a modest increase. The weakness was broad-based across regions and was led by a 3.4% MoM decline in the South.
Despite subdued sales activity, inventories continue to move toward better balance. Existing inventories rose to 1.56 million units, the highest June level since 2019. While inventory remains below historical norms, persistently weak sales have pushed months' supply closer to levels associated with the more balanced housing markets of the early 2000s and post-financial crisis 2010s.
With supply and demand more closely aligned – albeit at low transaction volumes – home price appreciation has remained modest. The median existing home price rose to a record $440,600 in June but was up just 1.8% from a year earlier, well below the pace of headline inflation. On an inflation-adjusted basis, the median sales price remains roughly 6% below its June 2022 peak.
Bottom line: Housing market conditions continue to improve from a balance perspective, but largely because weak demand has allowed inventories to rebuild rather than because sales activity has strengthened. Affordability challenges and the lock-in effect remain significant headwinds, limiting turnover despite a somewhat larger supply of homes available for sale. With the spring buying season now behind us, 2026 appears poised to join the previous two years as another disappointing year for existing home sales.
Economic trends: The week ahead
Data and reports we’re watching this week: Testing inflation, tracking the consumer
This week brings a heavy slate of economic data, with inflation reports and consumer spending figures likely to command the greatest attention. After a relatively quiet week for Federal Reserve communications, we will also hear from a broad range of Fed officials. Taken together, the week’s releases should help clarify whether recent inflation concerns are beginning to ease and whether consumer spending remains resilient.
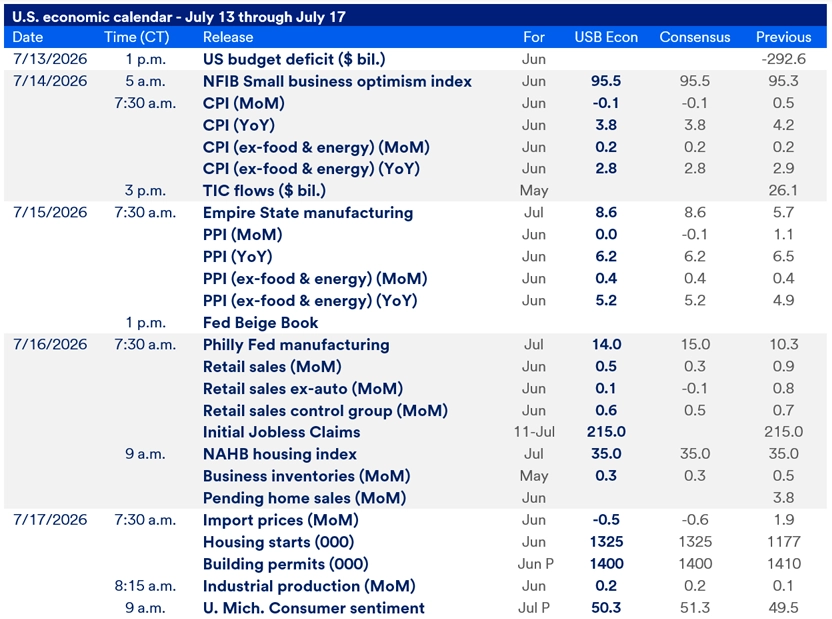
Tuesday’s June Consumer Price Index (CPI) report will be the week’s key release. We expect headline CPI to decline 0.1% MoM, lowering the year-over-year rate to 3.8%. However, underlying inflation pressures are likely to remain firmer. We anticipate core CPI, which excludes food and energy, will rise 0.2% on the month, matching May’s increase and bringing the year-over-year rate down only modestly to 2.8%. With policymakers increasingly focused on persistent inflation, the core figures will likely carry greater significance than any temporary relief from lower energy prices. A softer-than-expected reading would support the view that inflation is gradually moving in the right direction, while another firm report could reinforce concerns expressed in the June FOMC minutes.
Inflation remains in focus on Wednesday with the release of the June Producer Price Index (PPI). We expect headline producer prices to be unchanged on the month, while core PPI is expected to rise 0.4%, matching May's gain. Together, the CPI and PPI reports should provide a clearer picture of whether disinflation remains on track or is beginning to stall.
Thursday's June Retail Sales report will offer an important update on consumer spending, the largest component of U.S. economic activity. Despite ongoing affordability pressures, we continue to expect a resilient consumer. Lower gasoline prices may weigh on the headline figure, but we still anticipate retail sales to increase 0.5% MoM, with the control group expected to rise 0.6%. A firm report would reinforce the view that consumer spending remains a key source of economic growth.
Beyond the data, a busy calendar of Federal Reserve speakers will provide an opportunity to gauge how officials are interpreting recent inflation and labor market developments. Markets will be listening closely for indications that policymakers continue to share the inflation concerns evident in the June FOMC minutes.
Economic data calendar this week
What we’re watching this week, including release dates and projections from the U.S. Bank Economics Research Group.
Federal Open Market Committee (FOMC) Speaker Calendar
- July 13, 4:25 a.m.: Bowman (Board of Governors/Voter)
- July 13, 11:30 a.m.: Waller (Board of Governors/Voter)
- July 14, 9 a.m.: Warsh (Board of Governors/Voter)
- July 14, 11:40 a.m.: Barr (Board of Governors/Voter)
- July 14, noon: Goolsbee (Chicago Fed/Non-Voter)
- July 14, 12:30 p.m.: Cook (Board of Governors/Voter)
- July 14, 1:55 p.m.: Bowman (Board of Governors/Voter)
- July 15, 7:45 a.m.: Williams (New York Fed/Voter)
- July 15, 9 a.m.: Warsh (Board of Governors/Voter)
- July 15, noon: Cook (Board of Governors/Voter)
- July 15, 5:30 p.m.: Musalem (St. Louis Fed/Non-Voter)
- July 16, 11:30 a.m.: Logan (Dallas Fed/Voter)
- July 16, 12:25 p.m.: Schmid (Kansas City Fed/Non-Voter)
- July 16, 6 p.m.: Jefferson (Board of Governors/Voter)
Next update: Week of July 20
For additional insights, see our Monthly Macroeconomic Outlook and Chief Economist Beth Ann Bovino’s latest commentary.
If you have any questions about any of the topics above or want to learn more, please contact us to connect with a U.S. Bank corporate and commercial banking expert.
Not currently a subscriber? Sign up to get our economic insights delivered to your inbox weekly.
U.S. Bank Economics, Bloomberg
Tags:
U.S. Bank Economics Research Group
Beth Ann Bovino
Chief Economist
Ana Luisa Araujo
Senior Economist
Matt Schoeppner
Senior Economist
Adam Check
Economist
Andrea Sorensen
Economist
Past weekly reports
Visit the archive to read previous outlook reports from the U.S. Bank Economics Research Group.
Learn more
If you have any questions about any of these topics or want to learn more, please contact us to connect with a U.S. Bank Corporate and Commercial banking expert.