Beth Ann Bovino, chief economist, U.S. Bank
Soft landing? No longer just reading the T(reasury) leaves
Six months ago, the Fed looked to reset the usual hard landing and pull off a high-fidelity soft landing (the first since 1995). Inflation was cooling, with growth steady, and markets prepared for rate cuts. At the start of the year, we expected the U.S. economy to grow around 2.5% in 2026, with two cuts beginning in June. But that was then. Now, inflation is back in the front seat, changing the radio dial.
Inflation in May hit its fastest pace in more than three years, and pressure extends beyond energy. Core consumer services excluding housing is more than twice the Fed’s target. Healthcare, transportation and producer costs all point to pipeline pressure. Add summer travel and still-elevated gasoline prices, and the Fed had little reason to rush easing.
There is some relief: signs of a U.S.-Iran interim pact to reopen the Strait of Hormuz could push gasoline prices closer to pre-war levels. But markets are wary of building strategy on a large “if” with continued skirmishes keeping an end to the war at bay. Firmer personal income also gives the Fed room to wait. Our view: policy stays on hold through next year. Worries that the Fed would need to raise rates faded after the soft June jobs report, but so have expectations of a turbulence-free landing.
“Old indicators still matter, but they need backup. This cycle calls for closer focus on household balance sheets, real income, and debt burdens.”
Beth Ann Bovino, chief economist, U.S. Bank
For investors, the bigger issue is that the old recession playbook has not worked cleanly. In 2022, the classic warning lights flashed – aggressive tightening, an equity bear market, a prolonged yield-curve inversion, and leading economic index in recession territory. Check, check, check – and yet no recession arrived. It fooled me, too.
Why was that? The post-pandemic economy had shock absorbers. Many households locked in low fixed mortgage rates, muting the bite of higher rates. Fiscal support, excess savings, and a strong jobs market driving higher wage growth kept spending resilient, which helped business production. The Fed slammed on the brakes, but consumers rode in a car with unusually good suspension.
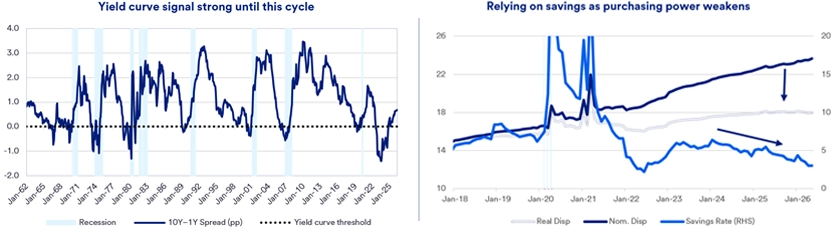
That cushion is thinning. The average mortgage rate outstanding has risen but remains below today’s market rate, keeping debt-service burdens manageable – for now. Not all households are protected, and higher inflation has squeezed real purchasing power. Real household income turned negative year-over-year in April – a warning sign, if not a recession call.
Old indicators still matter, but they need backup. This cycle calls for closer focus on household balance sheets, real income, and debt burdens. The labor market remains the real-time expansion stress test: in 2022, workers were job hoppers; today, more are job huggers.
Bottom line: A soft landing is still possible, but the margin for error has narrowed. Or, to borrow from Bette Davis, fasten your seatbelts – it’s going to be a bumpy ride.
Get more business-focused economic analysis
For additional insights, see our weekly economic report and monthly economic forecast.
If you have questions about any of the topics above or want to learn more, please contact us to connect with a U.S. Bank corporate and commercial banking expert.
Not currently a subscriber? Sign up to get our economic insights delivered to your inbox weekly.
Tags:
Explore more

Weekly economic highlights
Read the latest weekly update from the U.S. Bank Economics Research Group.

Monthly economic outlook
See the U.S. Bank Economics Research Group’s forecast for the upcoming month.
Past economic views
Visit the archive to read previous commentaries from U.S. Bank Chief Economist Beth Ann Bovino.