A K-shaped economy describes a recovery in which different parts of the economy move in opposite directions – some segments expand while others lag. The term gained prominence during the COVID-19 recovery, but it now serves as a broader framework for understanding how economic shocks are absorbed unevenly across households, industries and regions. In practice, this divergence often reflects differences in balance sheets, income stability and access to capital. Households and firms with stronger financial buffers are better positioned to benefit from asset appreciation and economic growth, while others remain more exposed to rising costs and changing economic conditions.
Article
The K-shaped economy in 2026: Uneven resilience and the forces shaping growth
July 8, 2026

Key takeaways
The term “K-shaped economy” emerged during the COVID‑19 pandemic to describe a diverging recovery, where some segments of society and industry rebounded quickly while others lagged.
The K-shape reflects a bifurcated path: high‑income households and capital‑intensive sectors benefit from asset appreciation and technological change, while lower‑wage workers and labor‑intensive sectors face more limited income growth and thinner financial buffers.
Today, the K-shaped economy is better understood as a structural pattern of uneven resilience – one that influences how growth is distributed, how shocks are absorbed and how risks emerge across the economy.
What is a K-shaped economy?
The term K-shaped economy emerged in the wake of the COVID-19 pandemic to describe a recovery marked by stark divergence – one in which some segments of society and industry rebounded swiftly while others lagged. Unlike traditional V- or U-shaped recoveries, which followed a more uniform growth path, the K-shape reflected a bifurcated path, where high-income households and knowledge-based sectors benefited from remote work, rapid asset appreciation and digital transformation, while lower-wage workers and labor-intensive sectors faced historic layoffs, prolonged disruption and weaker financial buffers.
But the K-shaped economy is not simply a post-pandemic recovery story. As highlighted in a recent U.S. Bank Economics Research Group report – “The K-economy in 2026: Same story, new amplifiers” – it is better understood as a decades-long pattern of uneven economic resilience. These divides show up across household balance sheets, labor market access, generational wealth-building and sector performance.
“The pandemic just made these differences more visible,” says Beth Ann Bovino, chief economist for U.S. Bank, “but the underlying forces have been building for decades.” That makes the K-shaped framework a useful lens for understanding resilience and vulnerability in today’s economy. Its structural imprint persists, shaping how growth is distributed across consumers and businesses while influencing policy debates.
Now, emerging forces – from higher-for-longer interest rates and elevated inflation to the growing adoption of artificial intelligence (AI) – are likely amplifying these dynamics. Therefore, as we assess the macroeconomic landscape in 2026, the K-shaped economy remains central to explaining both the uneven nature of growth and the balance of risks ahead.
“The K-shaped dynamic isn’t about any single shock – even one as visible as today’s oil-driven price pressures. It reflects how recurring shocks are absorbed unevenly across the economy.”
-
Beth Ann Bovino, chief economist, U.S. Bank
Anatomy of the K: Where the lines separate
To see how these dynamics take shape in the current environment, it is helpful to look across the areas where outcomes have increasingly diverged – household balance sheets, generational wealth-building, sector performance and labor market dynamics.
The upward arm of the K includes households and businesses with stronger buffers, more flexible sources of income and greater access to capital – positioning them to benefit from asset appreciation and ongoing technological change. The lower arm, by contrast, reflects households and firms with more limited savings, greater sensitivity to inflation and borrowing costs and heavier reliance on labor-intensive or in-person activity. “In that sense, the K-shaped dynamic isn’t about any single shock, even one as visible as today’s oil-driven price pressures,” notes Bovino. “It reflects how recurring shocks are absorbed unevenly across the economy.”
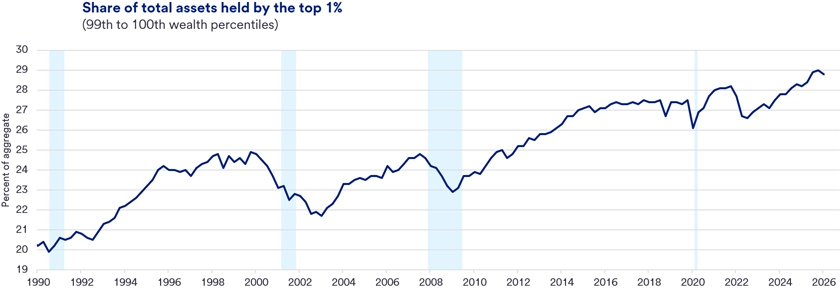
Income and wealth: The most visible divide remains household financial resilience. “Higher-income households are more likely to own homes, equities and retirement assets,” says Matt Schoeppner, senior economist for U.S. Bank, “allowing them to participate more directly when financial markets and home values rise.” Federal Reserve distributional data show that wealth remains highly concentrated. As of Q4 2025, the top 1% held 29.2% of aggregate wealth, up from closer to 20% in the early 1990s and compared with just 5.3% for the bottom half.1
That mounting concentration matters for the broader economy because spending strength is increasingly tied to those with the strongest balance sheets. Moody’s Analytics, for example, estimates that the top 10% of earners accounted for nearly half of U.S. consumer spending in 2025 – the highest share on record. 2This helps explain how aggregate consumption can remain relatively firm even as broader sentiment stays cautious and many households continue to face pressure from elevated prices and borrowing costs.
For lower- and middle-income households, the challenge is less about any single shock and more about a narrower margin for error. “Wage gains for most have been moderating, while essential costs for rent, groceries and gasoline remain elevated,” notes Schoeppner. “At the same time, savings buffers have continued to narrow while reliance on credit – particularly credit cards – has increased.” These dynamics do not point to broad-based stress, but they do suggest that financial capacity – and the ability to absorb shocks – remains unevenly distributed.
Generational divide: Age has emerged as another key dimension of divergence. Older households are more likely to have benefited from decades of home price appreciation, retirement account gains and lower locked-in borrowing costs, providing a cushion against periods of volatility. These advantages have compounded over time. Research using Federal Reserve data shows that households aged 75 and older now hold wealth roughly 55% above the national average, up from just 5% above in the early 1980s.3
Meanwhile, while younger households that have parents (or grandparents) with significant levels of wealth often benefit from wealth transfers, others with fewer sources available are entering peak household-formation years facing a different set of constraints – higher housing prices, elevated mortgage rates and renewed student loan obligations. The result is not simply a near-term spending constraint, but a slower path to building durable wealth.
“Because wealth accumulation compounds over time, these differences in starting point matter,” notes Bovino. “Households with access to appreciating assets and manageable financing costs can more readily convert income into wealth, whereas those facing higher barriers to entry may remain active participants in the economy, but with less capacity to save, invest or absorb disruptions.”
Sector performance: The same pattern is evident across businesses and industries. Firms with scale, stronger margins and access to capital are generally better positioned to manage rising wages, financing costs and supply-chain volatility, while also investing in productivity-enhancing technologies. Capital-intensive and knowledge-based sectors, in particular, have more pathways to convert investment into efficiency gains, particularly as automation and artificial intelligence adoption accelerate.
By contrast, labor-intensive sectors – such as restaurants, hospitality, retail and many smaller service firms – often operate with thinner margins, higher dependence on foot traffic and greater exposure to wage, rent and borrowing costs. While these sectors may benefit when demand is resilient, they have less flexibility to absorb cost pressures or fund longer-term investment.
Emerging technologies, including AI, may be reinforcing this divide. McKinsey recently estimated that by 2030 up to 30% of current work hours could be automated in a midpoint adoption scenario, with labor demand shifting toward STEM, healthcare and other higher-skill occupations while pressure rises on some office support, production and customer-service roles. 4 “Adoption tends to favor firms and workers with the scale, resources and a skill-base to deploy it effectively,” Schoeppner says, “suggesting that productivity gains – and the benefits that follow – may accrue unevenly, at least initially.”
Labor market segmentation: The labor market offers another important lens into this divergence. Headline conditions remain relatively stable – unemployment is low, and layoffs are limited – but underlying mobility has slowed significantly. Recent JOLTs data underscore that dynamic, as hiring rates have fallen to 15-year lows of around 3.2% while layoff rates remain near historically low levels of 1.1%.5
In a ‘low-hire, low-fire’ environment, workers who are already employed may experience stability, while job seekers and those looking to advance face fewer opportunities.
That matters because mobility is a key pathway for workers to improve earnings, move into higher-productivity roles and build financial buffers. “When hiring slows and job-switching premiums narrow,” Bovino says, “pathways to higher pay and better job matches become more limited.” As a result, the labor market can appear stable at the aggregate level while becoming less dynamic beneath the surface – particularly for workers in lower-wage or more cyclical industries.
Read the Economic Commentary
The K-economy in 2026: Same story, new amplifiers
Macro pressures in a divided economy
Viewed through this lens, the K-shaped economy is less about a single period of divergence and more about the distribution of growth. Strong aggregate performance can coexist with uneven outcomes, particularly when gains in spending, investment and productivity are driven disproportionately by households and firms with stronger balance sheets and greater access to capital. A higher-for-longer interest rate environment simply reinforces these dynamics, supporting returns for savers while increasing financing costs for more credit-sensitive households and businesses.
“This uneven distribution tends to complicate the economic outlook,” Bovino notes. “Consumer spending can remain resilient when higher-income households continue to spend, supported by asset values and stable employment. But it also narrows the base of demand, leaving the economy more sensitive to shifts in financial market volatility, confidence and discretionary activity.”
At the same time, inflation pressures can land unevenly across households. Higher-income households are generally better positioned to absorb elevated prices or sustain spending on services such as travel, dining and personal care. Lower- and middle-income households, by contrast, are more exposed as costs for necessities – including rent, groceries and borrowing – remain elevated. The Federal Reserve’s May Beige Book reflects this divide, noting that higher-income households have remained relatively resilient, while lower-income consumers are showing greater financial strain and increased reliance on credit. 6
Energy prices offer a clear example of how a common shock can affect purchasing power unevenly across households, particularly through gasoline. Recent tensions in the Middle East have kept oil prices volatile, with Brent crude pushing toward $100 per barrel through much of April and May. Schoeppner notes, “The resulting higher gasoline prices we’ve seen this spring may be more of an inconvenience for higher-income households, but for those with thinner buffers, they can quickly crowd out discretionary spending.” The San Francisco Fed has similarly noted that elevated gasoline and grocery costs are consuming a larger share of household budgets, adding pressure to overall spending.7
Lastly, credit conditions reveal a similar divide. While household stress does not appear broad-based, the lower arm of the K is more exposed to rising debt burdens and tighter access to credit. Bovino notes that “these households tend to rely more heavily on higher-cost borrowing and devote a larger share of income to debt service, leaving them more sensitive to higher rates and reduced credit availability.” Recent Beige Book commentary also points to increased reliance on credit among more financially constrained households, even as aggregate delinquency trends remain stable. Against that backdrop, the April 2026 Senior Loan Officer Opinion Survey shows tighter lending standards across key segments, suggesting that access to financing is becoming more constrained at the margin.8
The macro bottom line
The key implication is that the K-shaped economy can make the macro environment look more stable than it feels underneath. Growth remains supported, but increasingly dependent on a narrower base of demand, while inflation and credit pressures continue to land unevenly across households and sectors. In that sense, the K-shaped economy is not just a feature of recent cycles, it's a defining characteristic of how the economy absorbs shocks and generates growth today.
For businesses and policymakers, the implication is clear: understanding the economy’s trajectory requires looking beyond headline growth to the distribution of resilience underneath. The economy’s sustainability will depend on where resilience is concentrated, how durable that support is and which segments can adapt to the next shock.
FAQ
A K-shaped economy can help explain why aggregate indicators – such as employment, GDP growth and consumer spending – remain relatively resilient even when financial pressure is building in parts of the economy. When growth is supported by households and firms with stronger balance sheets, overall activity can remain stable. At the same time, a narrower base of demand can make the economy more sensitive to shifts in asset prices, confidence and credit conditions. This uneven distribution of growth can also contribute to differences in how inflation, interest rates and financial conditions are experienced across the economy, shaping both the pace and durability of expansion.
A K-shaped economy creates a more segmented operating environment for businesses. Companies that serve higher-income consumers or operate in capital-intensive sectors may benefit from stronger demand and greater pricing power. By contrast, firms that depend on broad-based or price-sensitive demand – particularly in labor-intensive or consumer-facing sectors – may face more persistent cost pressures and greater sensitivity to shifts in income and credit conditions. As a result, businesses may need to adjust pricing strategies, product offerings and investment decisions to align with a more uneven demand landscape. Understanding where growth is concentrated – and how resilient that demand is – becomes increasingly important for planning and risk management.”
Tags:
U.S. Bank Economics Research Group
Beth Ann Bovino
Chief Economist
Ana Luisa Araujo
Senior Economist
Matt Schoeppner
Senior Economist
Adam Check
Economist
Andrea Sorensen
Economist
Subscribe to our economic insights newsletter
Not currently a subscriber? Sign up to get our economic insights delivered to your inbox weekly.
Learn more
If you have any questions about any of these topics or want to learn more, please contact us to connect with a U.S. Bank Corporate and Commercial banking expert.
Start of disclosure content
Disclosures
Start of disclosure content