Webinar

2024 Investment Outlook

Capitalizing on today’s market opportunities to meet your financial goals.

Key takeaways

  • While interest rates seem poised for adjustments in 2024 – based on the likelihood of evolving Federal Reserve monetary policy – an unusual environment that emerged in 2022 persists today.

  • Yields on some shorter-term Treasury securities continue to exceed those of most longer-term Treasuries.

  • While this so-called “inverted yield curve” is viewed by some market observers as an indicator of potential recession, the economy today continues to prove resilient.

An unusual trend that emerged in 2022 affecting fixed income securities persists today, as yields on short-term Treasuries continue to exceed those of longer-term bonds. This is contrary to normal financial market logic where investors would expect to earn higher yields for committing to a longer-term investment. For example, investors typically expect to collect more for investing in a security that matures in ten or more years than from a security that matures in three months to two years. The impetus for this so-called “yield curve inversion” traces back to a significant shift in monetary policy in 2022 by the Federal Reserve (Fed).

When inflation first emerged as a major issue in 2021 and 2022, the Fed, as a function of its mandate to maintain price stability, increased the short-term federal funds target rate it controls. This is one of the tools the Fed uses to influence the economy. The Fed boosted the federal funds rate, which was near 0% in early 2022, to a range of 5.25% to 5.50% by July 2023. As a result, publicly traded bond yields moved higher across the board, with the most dramatic increases occurring among shorter-term instruments.

Understanding the yield curve

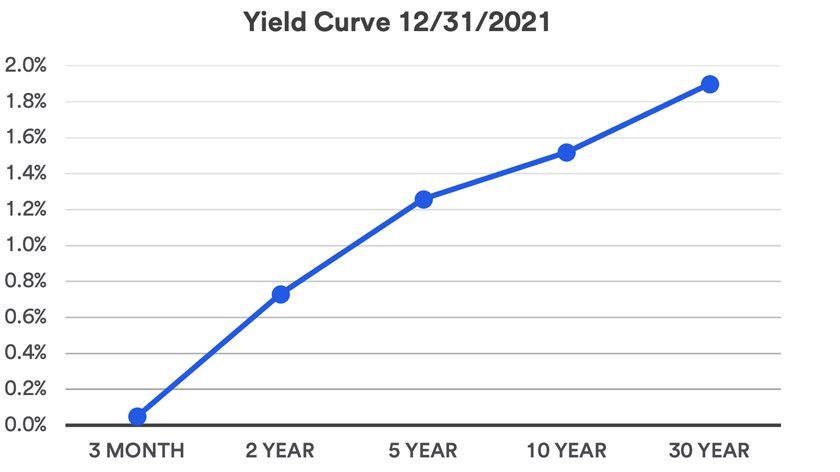
A simple way to view the yield curve is by comparing current interest rates, or yields, on U.S. Treasury securities with maturities of three months, two years, five years, 10 years and 30 years. Investors typically demand higher yields when investing their money for longer periods of time. This is referred to as a normal, upward sloping yield curve. In this scenario, yields rise along the curve as bond maturities lengthen. The chart below depicts a normal, upward sloping yield curve among these U.S. Treasury securities of varying maturities, depicting actual yields in the Treasury market at the end of 2021. At that time, the yield on 3-month Treasury bills stood at 0.05% and moved progressively higher as maturities extended along the yield curve, up to a yield of 1.90% on 30-year Treasury bonds.1

Chart depicts a normal, upward sloping yield curve among five U.S. Treasury securities, depicting actual yields in the Treasury market at the end of 2021.
Source: U.S. Department of the Treasury, December 31, 2021.

However, at rare times, the yield curve “inverts.” The use of this term does not necessarily indicate that the slope moves consistently higher to lower across the yield spectrum when reading the chart from left to right. But it can mean that yields on some shorter-term securities are higher than those for some longer-term securities.

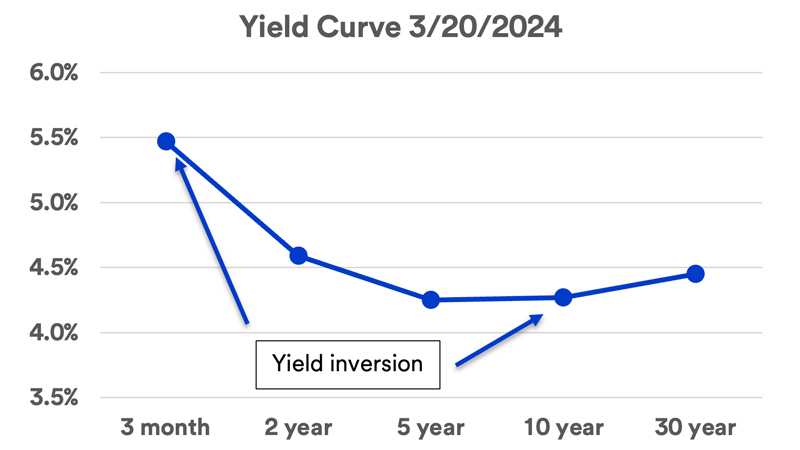
In late October 2022, the yield on the very short-term 3-month Treasury bill moved above that of the 10-year Treasury note. The inversion has continued since that time, though the shape of the curve has changed.

Chart depicts an inverted, downward sloping yield curve among five U.S. Treasury securities, depicting actual yields in the Treasury market as of March 20, 2024.
Source: U.S. Department of the Treasury, as of March 20, 2024.

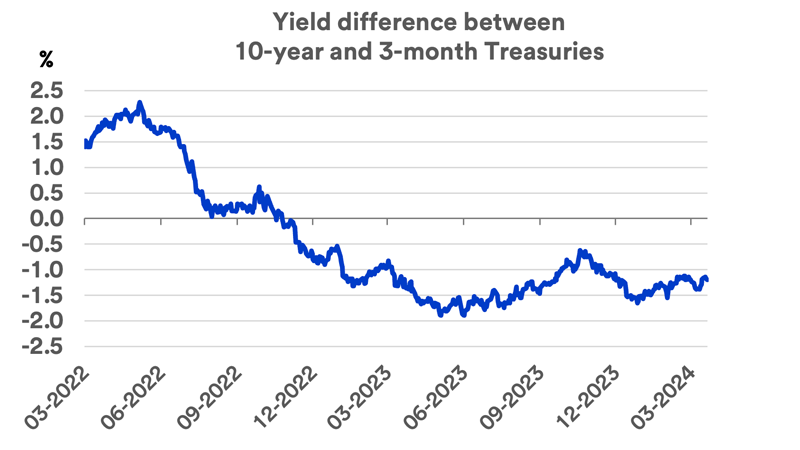
The inversion today is flatter than it was during periods in 2023. As of March 20, 2024, the yield on the 3-month Treasury bill was 5.47%. By comparison, the yield was 4.27% for the 10-year U.S. Treasury note, a 1.20% spread. The spread, or yield advantage for 3-month Treasuries over 10-year Treasuries, was as high as 1.88% in May 2023.1

Graph depicts the differences in yields paid on 10-year U.S. Treasury bonds and 3-month U.S. Treasury notes as of March 20, 2024.
Source: Federal Reserve Bank of St. Louis. As of March 20, 2024.

The Fed’s role in yield curve dynamics

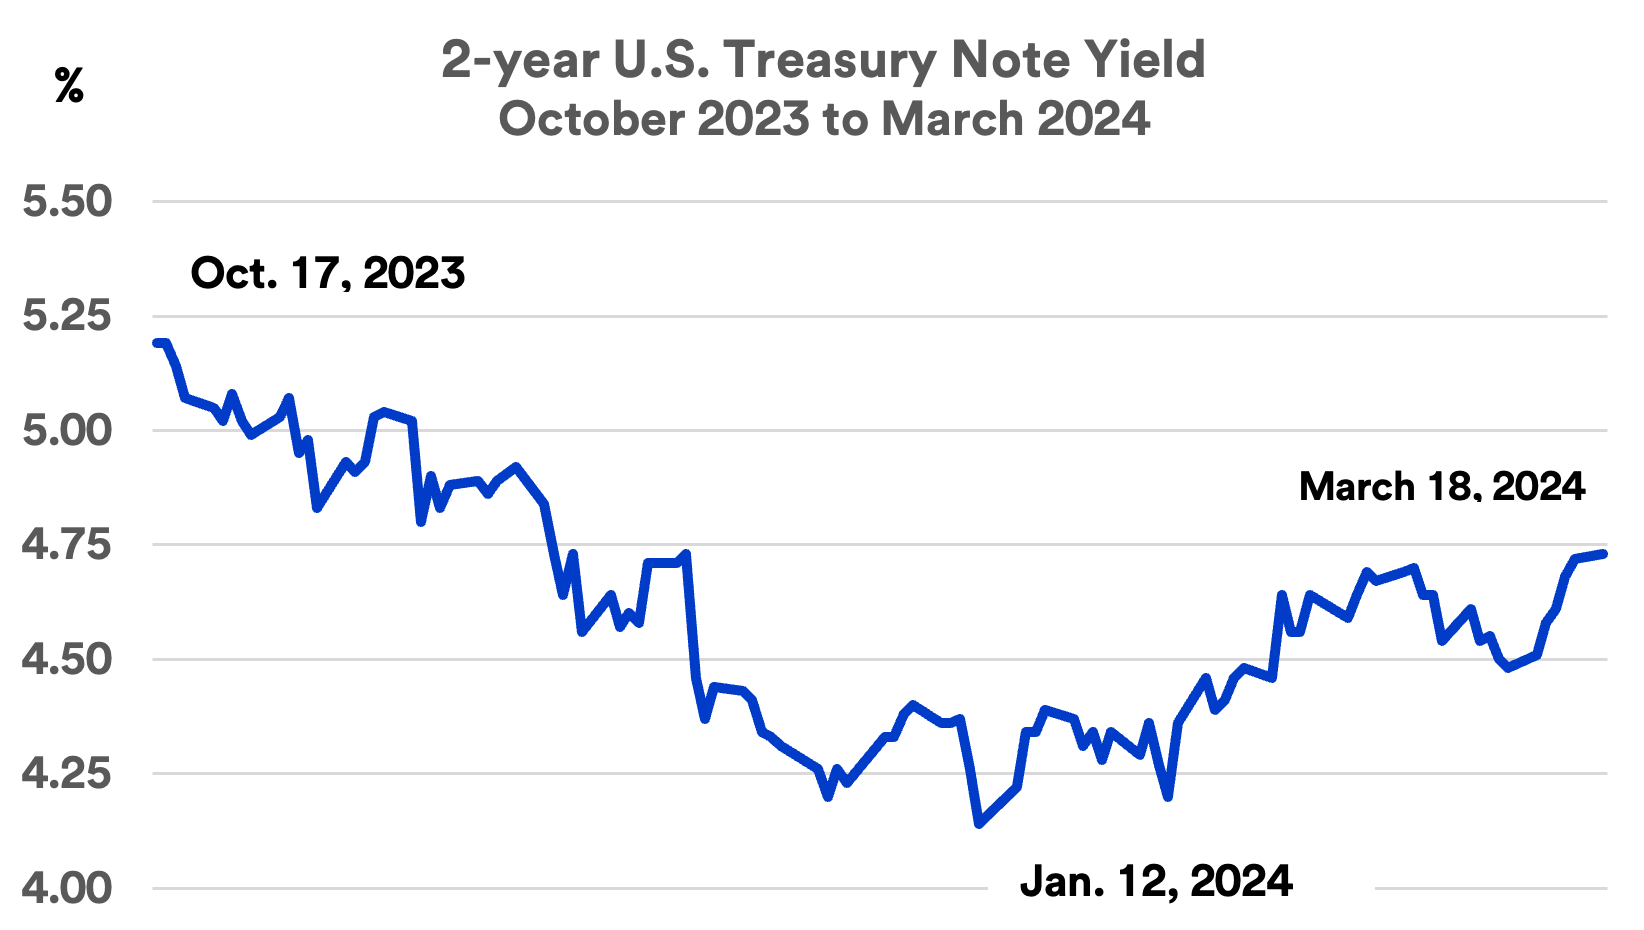
The direction of the yield curve is likely to be highly dependent on Fed interest rate policy, says Rob Haworth, senior investment strategy director at U.S. Bank Wealth Management. “Short-term bond yields are firmly anchored to the Fed’s rate moves.” Haworth notes that while 3-month Treasury bill rates held relatively firm in recent months, yields on 2-year U.S. Treasury notes and some longer-term bonds reflected investor anticipation of pending Fed rate cuts. For example, 2-year Treasury bill yields exceeded 5% in mid-October 2023. As speculation grew that Fed rate cuts could occur in early 2024, the yield dropped more than 1%, to 4.14%, by mid-January. However, as it became apparent the Fed was in no rush to begin fed funds rate cuts, the 2-year yield jumped back up to 4.73% in March.

Chart depicts the yield on the U.S. Treasury Note during the time period of October 17, 2023, and March 18, 2024.
Source: U.S. Department of the Treasury, as of March 18, 2024.

While Fed officials have indicated that rate cuts will likely occur in 2024, the timing of those cuts is in question. Economic data released so far in 2024 has created more skepticism that rate cuts will happen in the near term. “The inverted yield curve is most likely with us until those Fed rate cuts begin,” says Haworth.

He also points out that (as indicated in the March 20, 2024, yield curve chart above), the yield curve between five-year and 30-year bonds has begun to return to a more normal slope. “The inversion at this point is just with the very low end of the yield curve in comparison to longer-term bonds,” says Haworth. After its March 2024 meeting, Fed chair Jerome Powell confirmed expectations that interest rate cuts were likely in 2024, a sign that the Fed is close to achieving its goals of taming inflation. However, he also made clear that “we are prepared to maintain the current target range for the federal funds rate for longer, if appropriate.”2

Some believe an inverted yield curve signals the potential for a recession. Haworth points out, however, that the reliability of the inverted yield curve as a harbinger of recession is questionable. “We only have data going back less than 50 years, so the causality connection may not be infallible.”

Fading recession risks?

While some anticipated that a recession was on the horizon once the yield curve inverted, Haworth points out the inverted yield curve as a recession signal is questionable. “We only have data going back less than 50 years, so the causality connection may not be infallible.” The U.S. economy maintained steady growth since the Fed’s rate hikes began in early 2022, with real Gross Domestic Product (GDP) expanding at a rate of 2.5% in 2023.3 “The job market remains strong, and there are no signs of significant deceleration in economic growth,” notes Haworth. To underscore Haworth’s point, Fed officials now project the U.S. economy growing by 2.1% in 2024, only modestly below 2023’s growth rate.4

Haworth cautions that the current interest rate environment creates headwinds for business investment. “It represents a steeper cost for corporations. With short-term rates so high, companies could become increasingly reluctant to borrow, as it is more challenging to realize a payoff when investing the borrowed capital in new equipment and facilities or added employees.” Despite this, Haworth recognizes that “many corporations are not yet showing signs of distress when it comes to their debt load and continue to maintain strong balance sheets.”.

Investment considerations in today’s unusual environment

With yields higher on short-term securities, it’s no surprise investors have put significant sums to work on the short-end of the yield continuum. However, Haworth recommends investors also consider longer-term bonds, with yields that are far more attractive today than they were at the start of 2022. “Investors who kept money out of long-term bonds may want to position assets back toward a more normal allocation into the longer-end of the market,” says Haworth.

One consideration for bond investors is the risk of rising interest rates. When interest rates rise, values of bonds held in an existing portfolio lose market value. “A 30-year bond is much more sensitive to interest rate movements than a 6-month bond,” says Eric Freedman, chief investment officer at U.S. Bank Wealth Management. Yet Freedman believes attractive interest rates create opportunities for investors. “It may be a time for fixed income investors to spread out exposures across the maturity spectrum.”

Haworth notes there’s increasingly positive investor sentiment for non-Treasury segments of the market. This includes corporate bonds, municipal bonds (for tax-aware investors) and collateralized loan obligations. “These types of securities offer the potential for investors to enhance yields in a portion of their fixed income portfolios,” says Haworth.

Check-in with your wealth planning professional to make sure you’re comfortable with your current mix of investments and that your portfolio’s asset allocations remain consistent with your goals, risk appetite and time horizon.


Frequently asked questions

Related articles

Is the economy at risk of a recession?

The Federal Reserve is focused on fighting inflation with monetary policy intended to slow consumer demand. Does this put the economy at risk of a recession?

Cash management and investing strategies when interest rates are up

A fresh look at managing your cash and investments in today’s changing interest rate environment can help support your pursuit of the goals that matter most to you.

Start of disclosure content
Disclosures
  1. Source: U.S. Department of the Treasury, Daily Treasury Par Yield Curve Rates.

  2. Board of Governors of the Federal Reserve System, “Transcript of Chairman Powell’s Press Conference Opening Statement,” March 20, 2024.

  3. Source: U.S. Bureau of Economic Analysis.

  4. Board of Governors of the Federal Reserve, “Summary of Economic Projections,” March 20, 2024.

Start of disclosure content

Investment and insurance products and services including annuities are:
Not a deposit • Not FDIC insured • May lose value • Not bank guaranteed • Not insured by any federal government agency.

U.S. Wealth Management – U.S. Bank is a marketing logo for U.S. Bank.

Start of disclosure content

U.S. Bank and its representatives do not provide tax or legal advice. Your tax and financial situation is unique. You should consult your tax and/or legal advisor for advice and information concerning your particular situation.

The information provided represents the opinion of U.S. Bank and is not intended to be a forecast of future events or guarantee of future results. It is not intended to provide specific investment advice and should not be construed as an offering of securities or recommendation to invest. Not for use as a primary basis of investment decisions. Not to be construed to meet the needs of any particular investor. Not a representation or solicitation or an offer to sell/buy any security. Investors should consult with their investment professional for advice concerning their particular situation.

U.S. Bank does not offer insurance products but may refer you to an affiliated or third party insurance provider.

U.S. Bank is not responsible for and does not guarantee the products, services or performance of U.S. Bancorp Investments, Inc.

Equal Housing Lender. Deposit products are offered by U.S. Bank National Association. Member FDIC. Mortgage, Home Equity and Credit products are offered by U.S. Bank National Association. Loan approval is subject to credit approval and program guidelines. Not all loan programs are available in all states for all loan amounts. Interest rates and program terms are subject to change without notice.